Trade
Basic
Futures
Futures
Hundreds of contracts settled in USDT or BTC
Options
HOT
Trade European-style vanilla options
Unified Account
Maximize your capital efficiency
Demo Trading
Futures Kickoff
Get prepared for your futures trading
Futures Events
Participate in events to win generous rewards
Demo Trading
Use virtual funds to experience risk-free trading
Earn
Launch
CandyDrop
Collect candies to earn airdrops
Launchpool
Quick staking, earn potential new tokens
HODLer Airdrop
Hold GT and get massive airdrops for free
Launchpad
Be early to the next big token project
Alpha Points
NEW
Trade on-chain assets and enjoy airdrop rewards!
Futures Points
NEW
Earn futures points and claim airdrop rewards
Investment
Simple Earn
Earn interests with idle tokens
Auto-Invest
Auto-invest on a regular basis
Dual Investment
Buy low and sell high to take profits from price fluctuations
Soft Staking
Earn rewards with flexible staking
Crypto Loan
0 Fees
Pledge one crypto to borrow another
Lending Center
One-stop lending hub
VIP Wealth Hub
Customized wealth management empowers your assets growth
Private Wealth Management
Customized asset management to grow your digital assets
Quant Fund
Top asset management team helps you profit without hassle
Staking
Stake cryptos to earn in PoS products
Smart Leverage
NEW
No forced liquidation before maturity, worry-free leveraged gains
GUSD Minting
Use USDT/USDC to mint GUSD for treasury-level yields
More
TraderXNehal
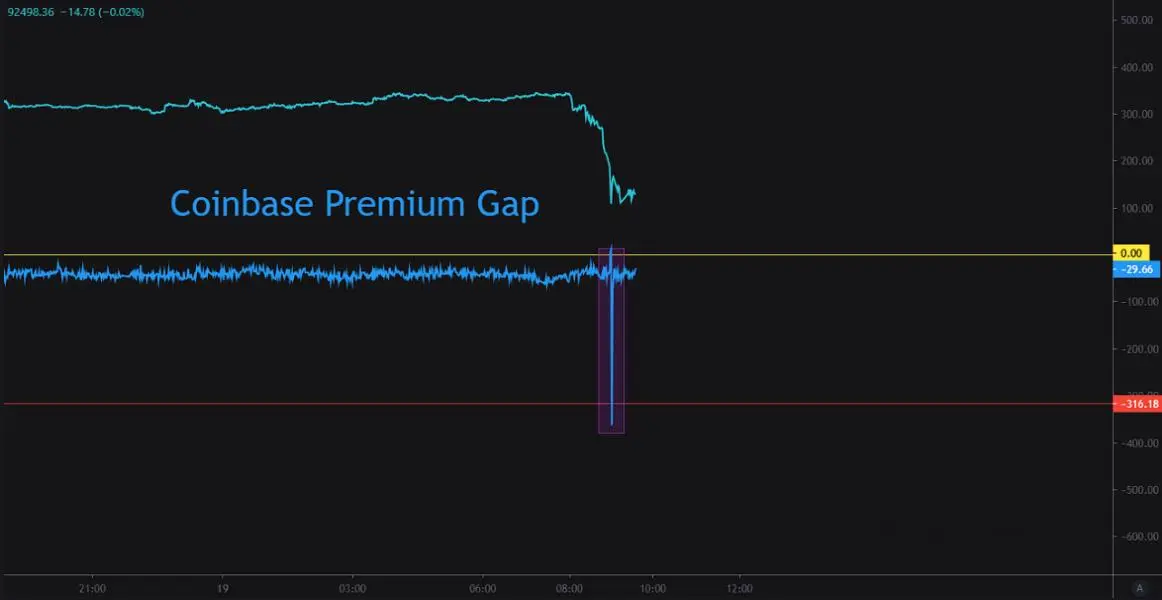
🇺🇸🐳 Strongest CPG Premium in Recent Periods
“Since the ETF market was not open at the time, this selling pressure is coming from U.S. whales operating outside of ETFs.” #etf
“Since the ETF market was not open at the time, this selling pressure is coming from U.S. whales operating outside of ETFs.” #etf
- Reward
- like
- Comment
- Repost
- Share
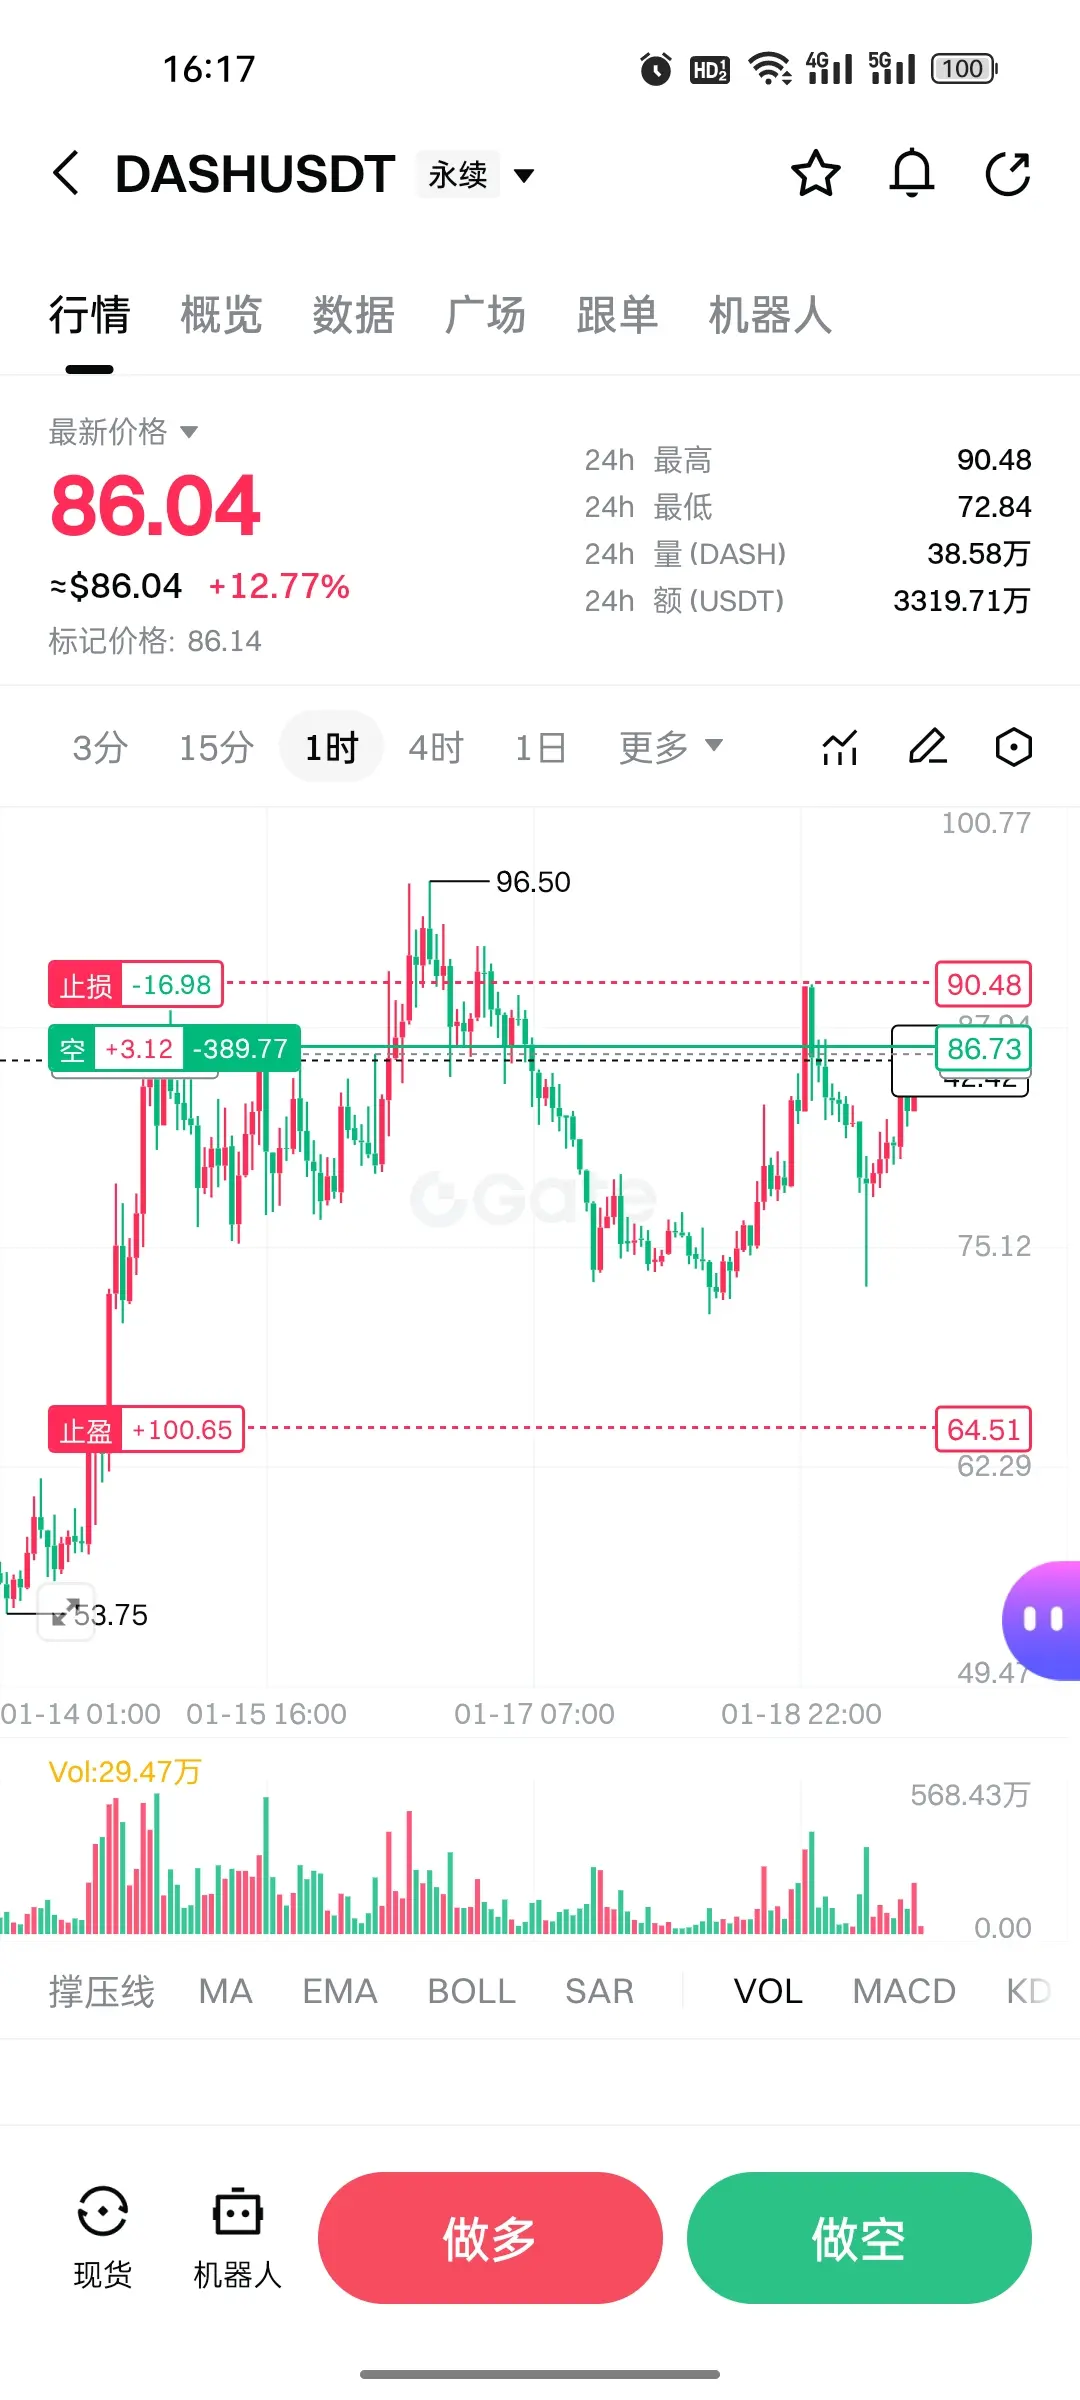
DASH Short-term Downtrend Confirmed, Technical Collapse Approaching
From a technical perspective, DASH's upward momentum has been completely exhausted. After an initial rally, the price faced resistance at 96.50, forming a double top pattern. The subsequent correction directly broke the key neckline, confirming a reversal signal.
Currently, the MACD indicator has formed a death cross at a high level, with the red histogram continuously shrinking and the green histogram rapidly expanding, indicating that the bearish force is dominating the market. Although the KDJ indicator has temporarily rebo
DASH9,41%
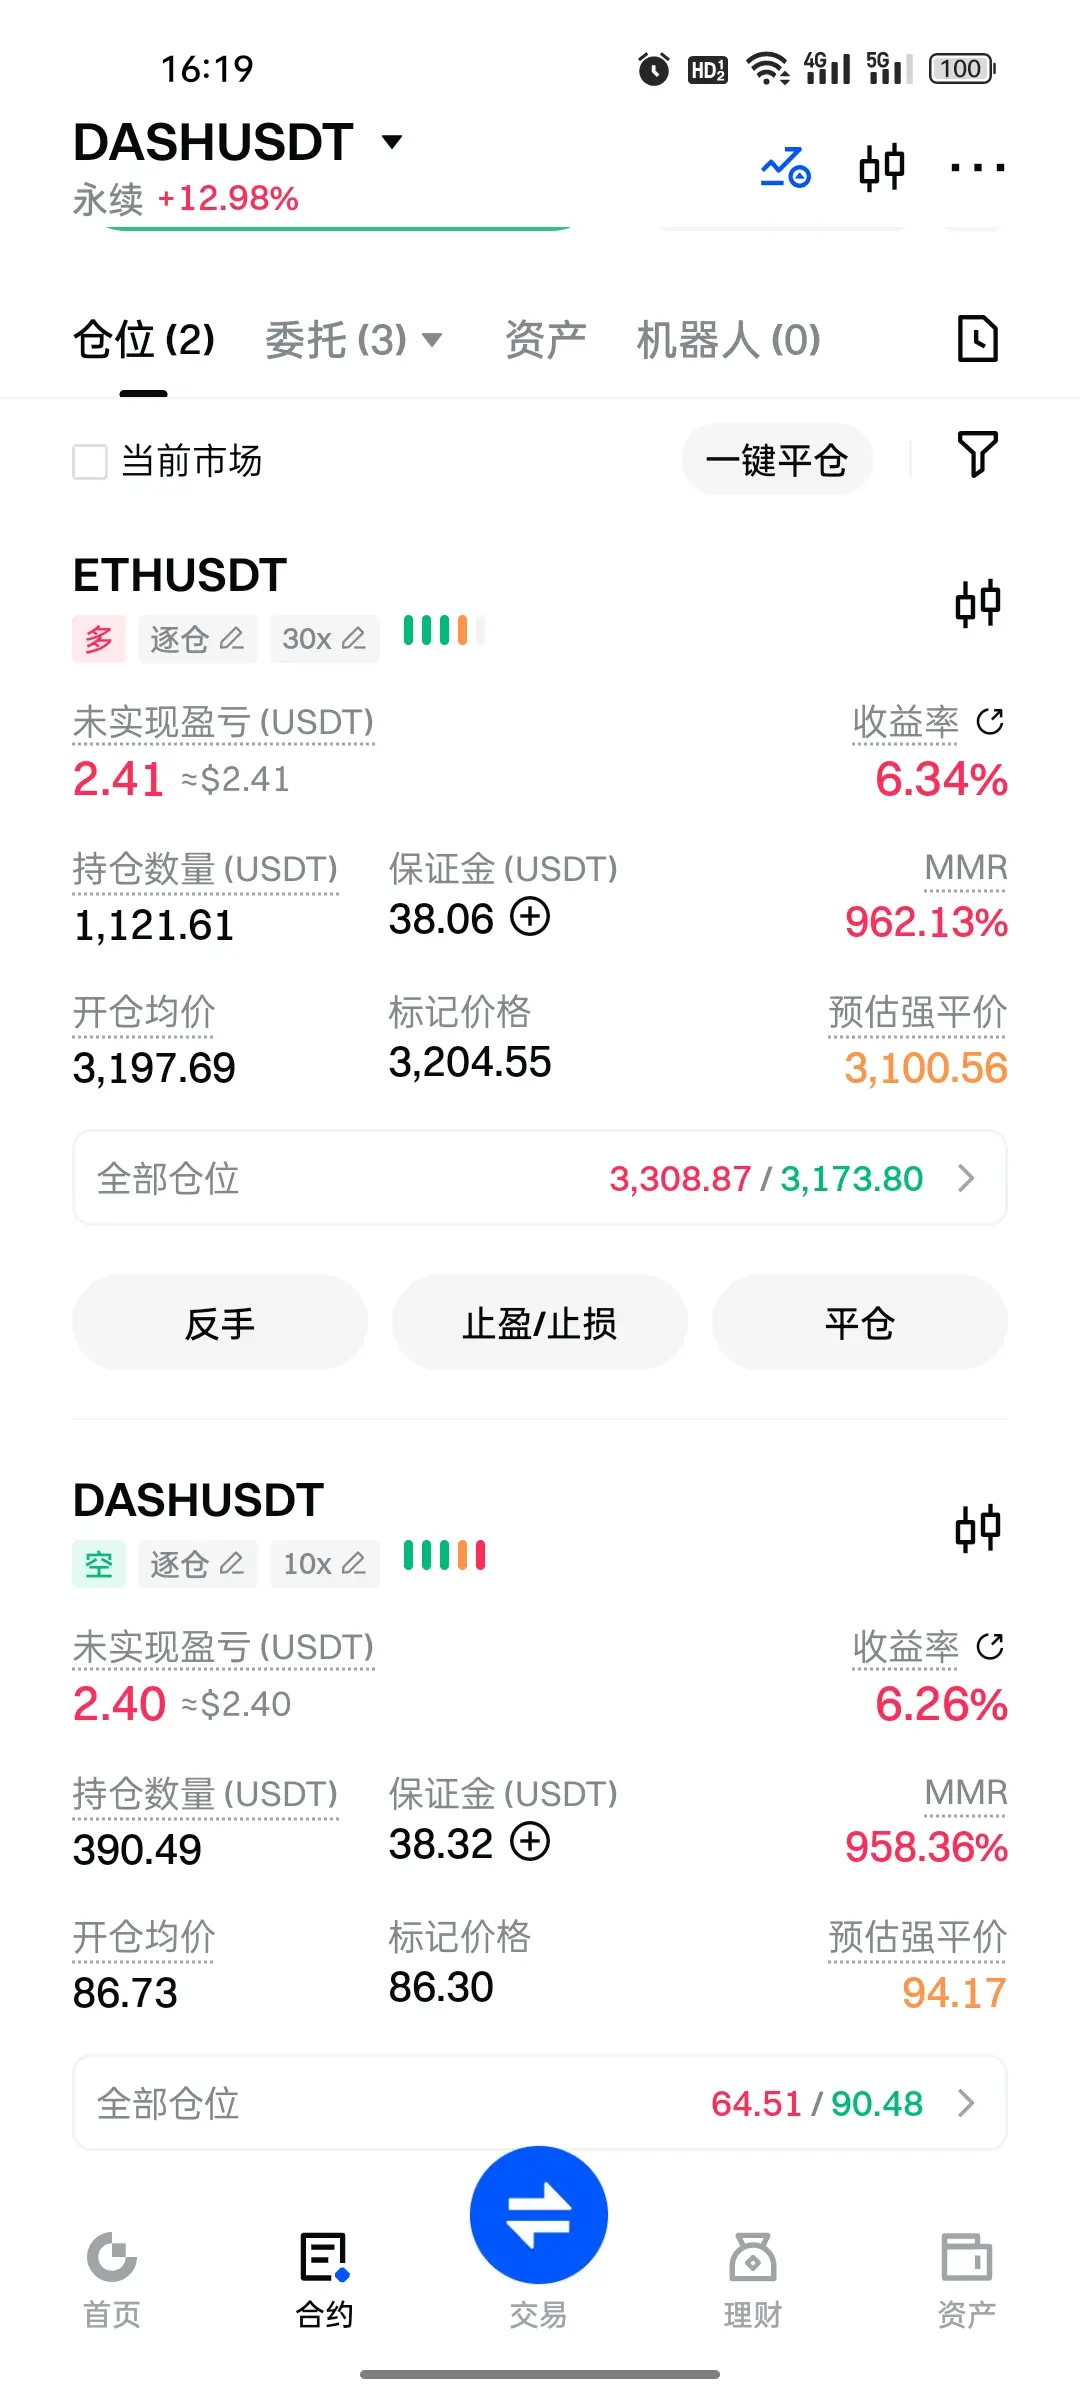
[The user has shared his/her trading data. Go to the App to view more.]
- Reward
- like
- Comment
- Repost
- Share
- Reward
- like
- Comment
- Repost
- Share
666
牛马崛起
Created By@GateUser-9bdc5b17
Subscription Progress
0.00%
MC:
$0
Create My Token
This wave of market movement
Short or bottom-fishing
View OriginalShort or bottom-fishing
- Reward
- like
- Comment
- Repost
- Share
🚨 TRUMP: GREENLAND IS NO LONGER NEGOTIABLE
Big statement from Trump: NATO warned Denmark for 20 years about the threat from Russia, but no action was taken.
Now Trump has clearly stated, "Now it is time, and it will be done!"
Big statement from Trump: NATO warned Denmark for 20 years about the threat from Russia, but no action was taken.
Now Trump has clearly stated, "Now it is time, and it will be done!"

- Reward
- like
- Comment
- Repost
- Share

- Reward
- like
- Comment
- Repost
- Share
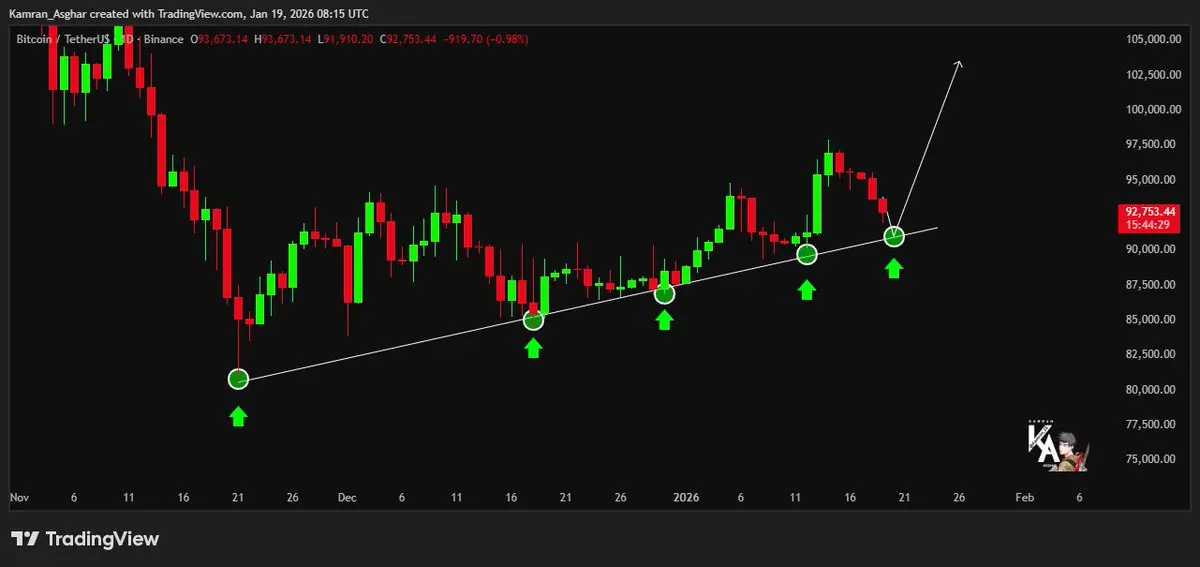
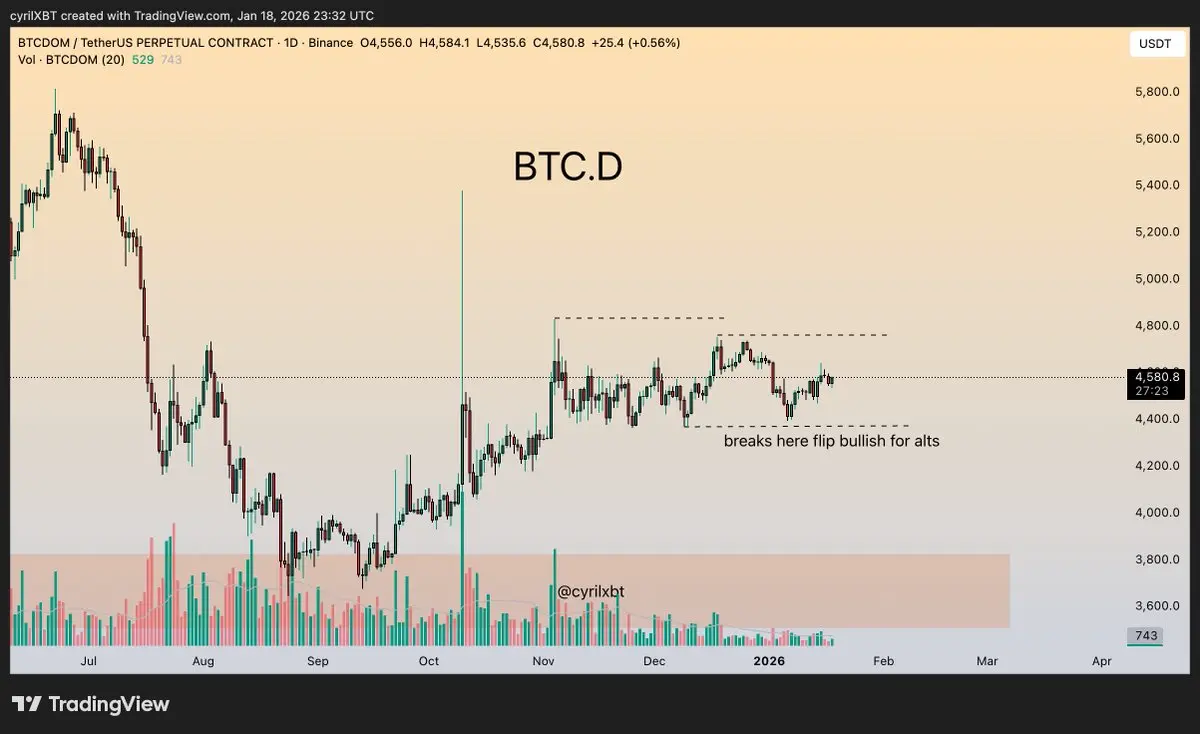
BTC.D is compressing after a strong move up.
This is usually the deceptive part of the cycle where nothing looks clear.
If dominance starts accepting lower from here, that’s historically when alts get room to run.
Until then, I’m treating this as a grind, not a trend.
This is usually the deceptive part of the cycle where nothing looks clear.
If dominance starts accepting lower from here, that’s historically when alts get room to run.
Until then, I’m treating this as a grind, not a trend.
BTC-2,08%
- Reward
- like
- Comment
- Repost
- Share
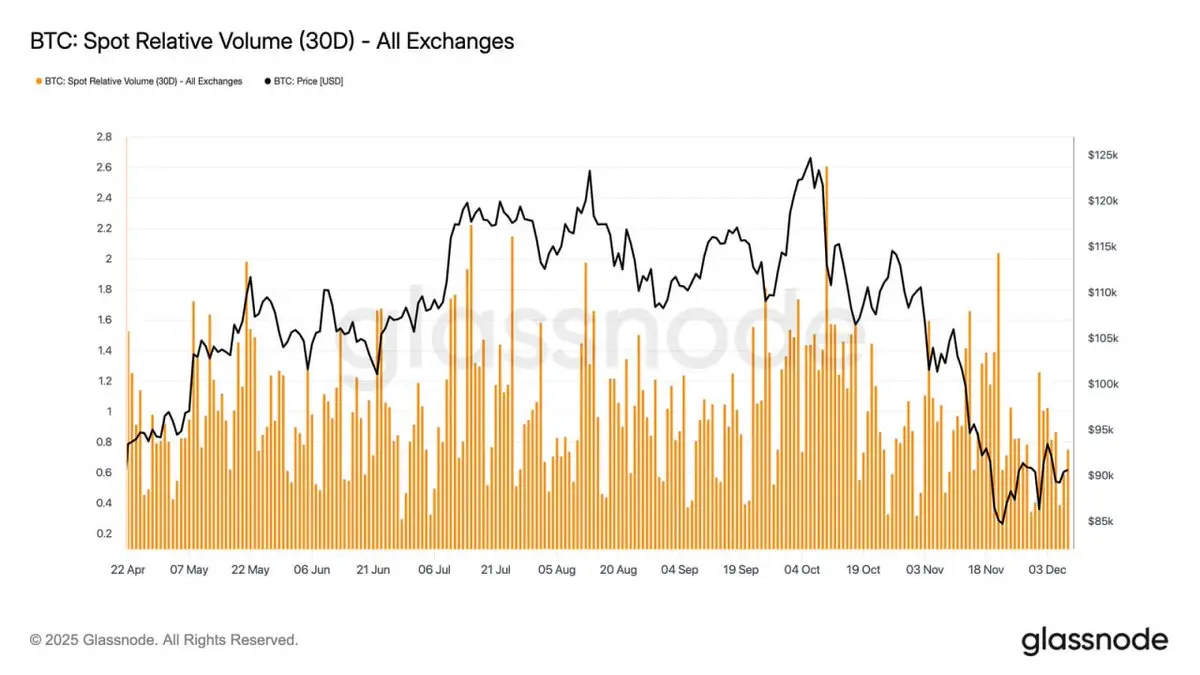
Bitcoin's spot volume near 30-day range lows 📉📊. Activity weakened through November-December, mirroring price decline and showing participation retreat ⚡️💼.
Volume contraction reflects defensive positioning with less liquidity for volatility 👀. Attention shifts to FOMC meeting for potential catalyst 🎯💰.
Volume contraction reflects defensive positioning with less liquidity for volatility 👀. Attention shifts to FOMC meeting for potential catalyst 🎯💰.
BTC-2,08%
- Reward
- like
- Comment
- Repost
- Share
Gate Annual Report is out! Let's take a look at my yearly performance
Click the link to view your exclusive #2025Gate年度账单 and receive a 20 USDT position experience voucher https://www.gate.com/zh/competition/your-year-in-review-2025?ref=VQUQBWXBAG&ref_type=126&shareUid=U1lEXV9aCQcO0O0O
View OriginalClick the link to view your exclusive #2025Gate年度账单 and receive a 20 USDT position experience voucher https://www.gate.com/zh/competition/your-year-in-review-2025?ref=VQUQBWXBAG&ref_type=126&shareUid=U1lEXV9aCQcO0O0O

- Reward
- like
- Comment
- Repost
- Share
#Gate 2025 Year-End Community Gala#
Top Streamers & Content Creators Year-End Awards
Who will be the Top Streamers of the Year? Who will claim the top spot on the Content Creator leaderboard? Join me in voting to support your favorite streamers and creators, and witness the rise of community stars!
https://www.gate.com/activities/community-vote-2025?ref=VVHFUFELUQ&refUid=43079898&ref_type=165&utm_cmp=xjdtmcgP

- Reward
- like
- Comment
- Repost
- Share
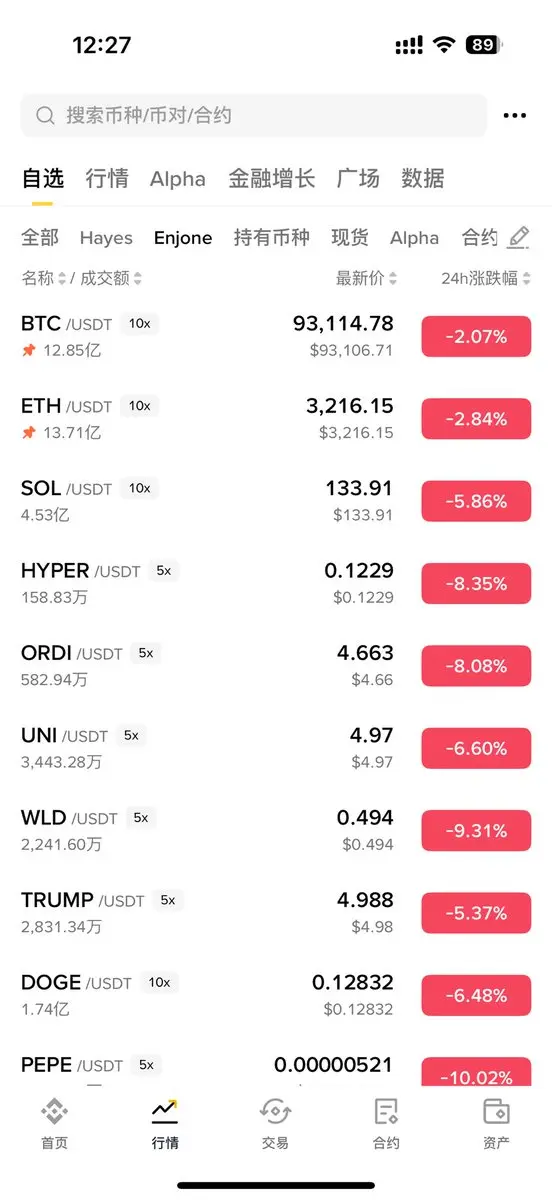
What's the Next Hot Spot in Crypto?
307
- Reward
- like
- Comment
- Repost
- Share
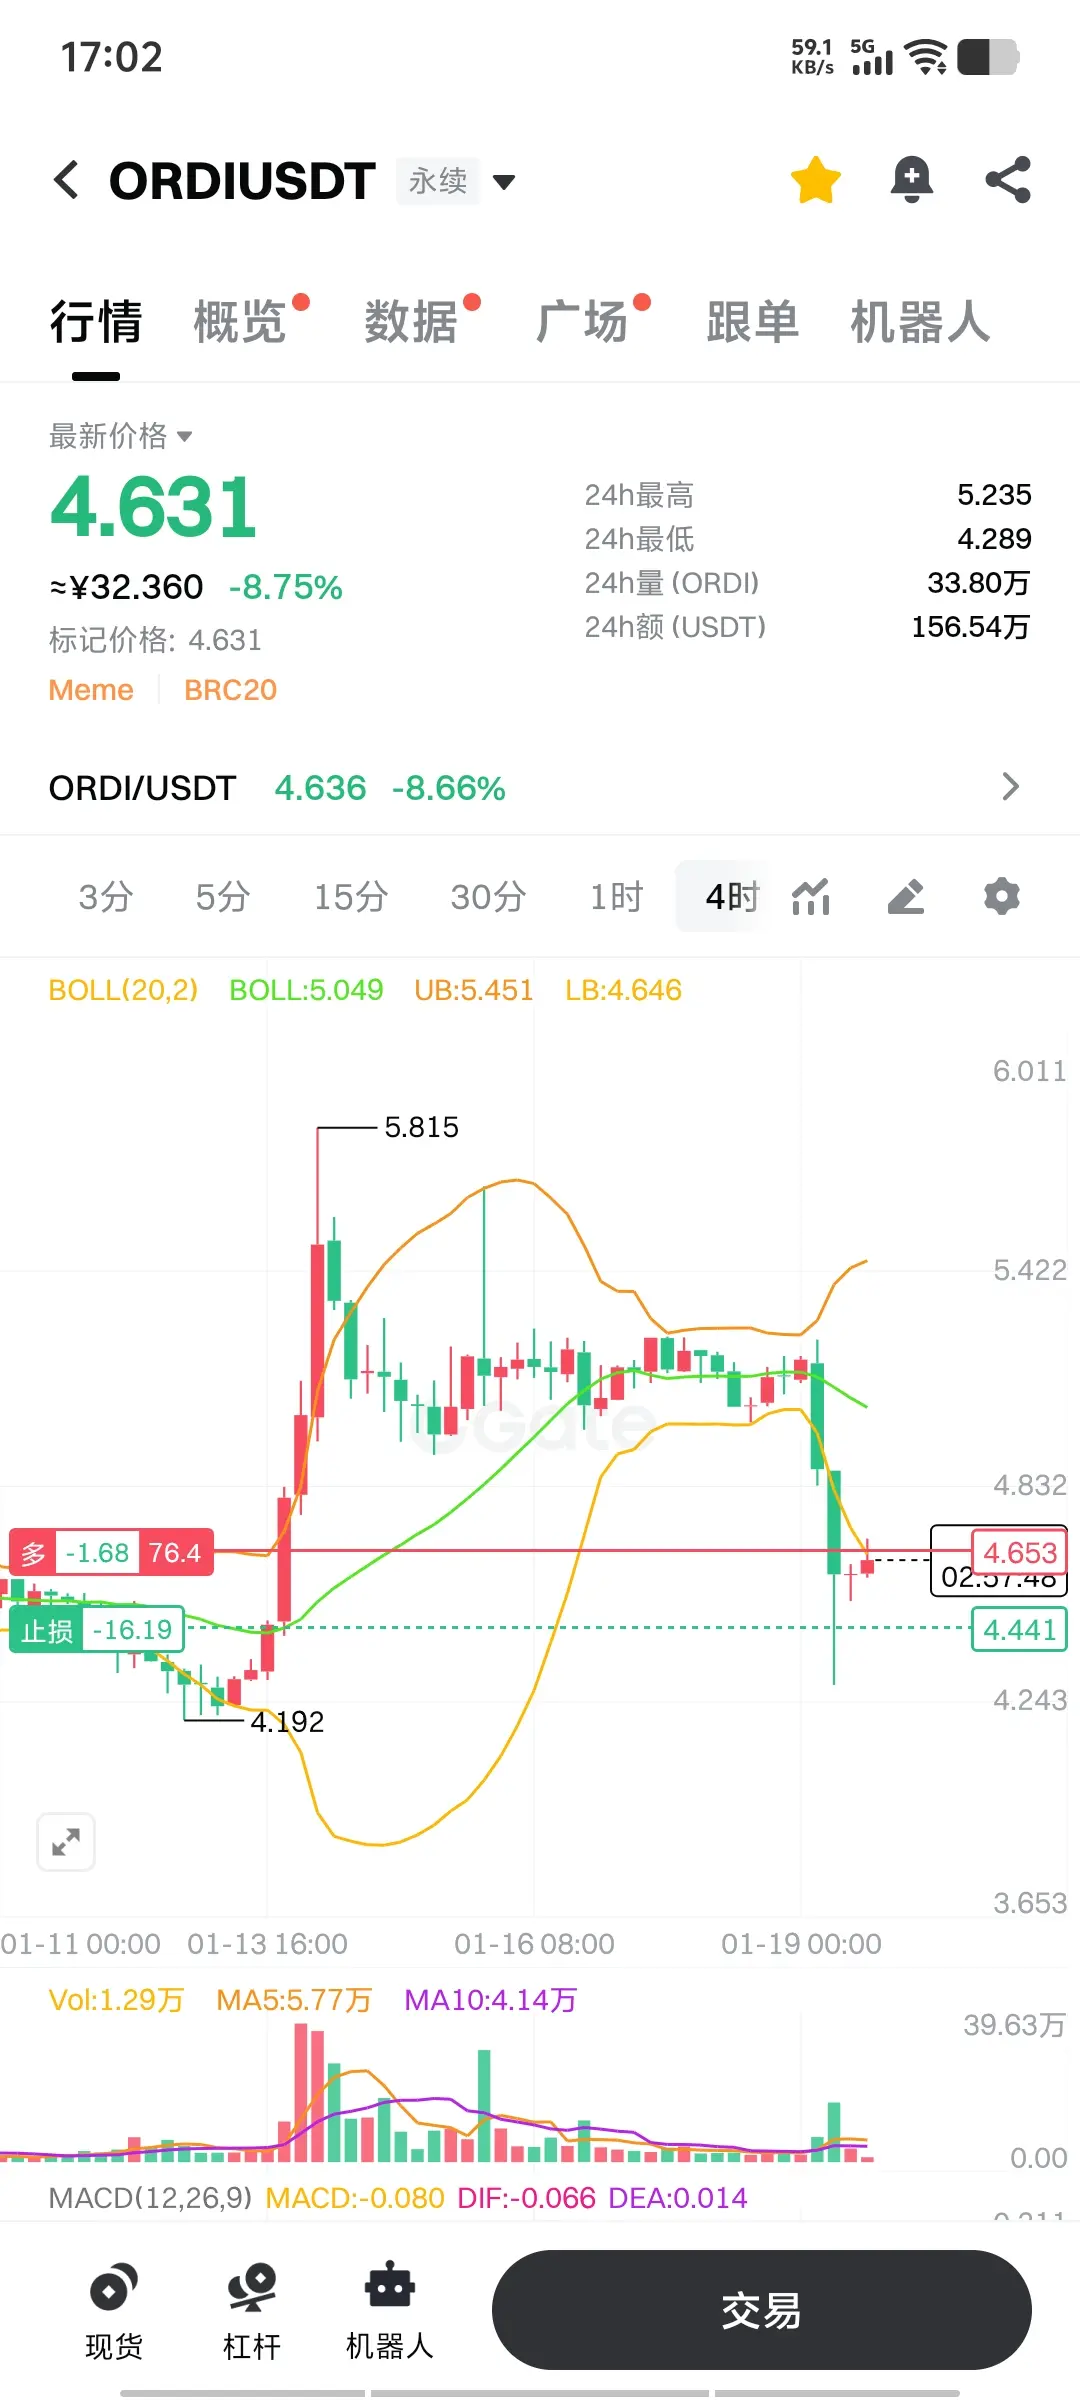
Today you can follow $ORDI
1. Conservative Long Positions: 4.40–4.45 USDT
This range is the recent low support zone for the pullback and also a key support level below the lower band of the Bollinger Bands. If the price retraces to this range and shows signs of stabilization (such as a doji or a lower shadow), you can enter a small position, with a stop loss set below 4.30 USDT.
2. Aggressive Long Positions: 4.55–4.60 USDT
If the price rebounds quickly and stabilizes above the Bollinger Bands lower band (4.646 USDT) in a consolidation zone, you can try a small long position in the 4.55–4.60
ORDI-9,01%
- Reward
- like
- Comment
- Repost
- Share
I've said many times in various occasions, "Money can't be spent all, but it can be lost all," most people's bullets are consumed in some meaningless market movements. When the real trend arrives, they find their bullets are gone, so sometimes it's better to deliberately slow down.
Trading is definitely about earning from cycles and trends, not about making quick scalp profits every day. Making big money through trading usually happens at a specific moment—when you are heavily invested in a certain coin and happen to catch a wave of trend.
The recent market conditions are, for me, considered d
ETH-3,18%


- Reward
- like
- Comment
- Repost
- Share
mb
mr beard
Created By@GateUser-2696e609
Subscription Progress
0.00%
MC:
$0
Create My Token
GM guys
The grind started when you woke up
The grind started when you woke up

- Reward
- like
- Comment
- Repost
- Share
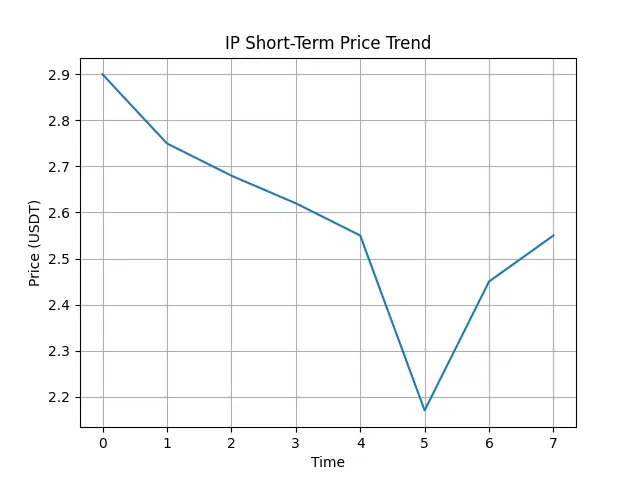
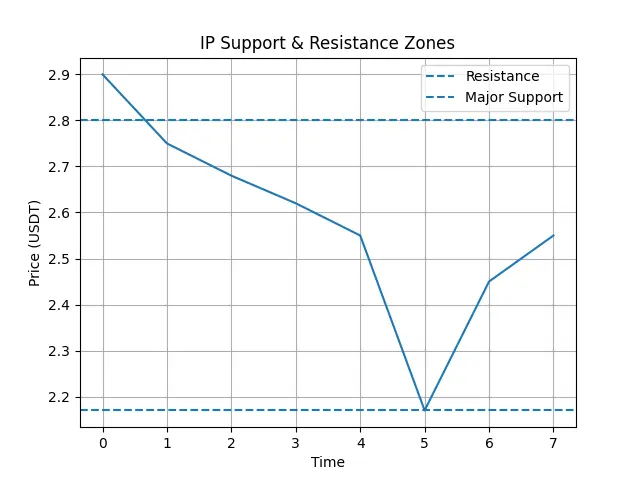
$IP IP saw a strong rejection near the 2.90 zone, followed by a sharp downside move toward 2.17. That drop looks like a fast liquidity sweep. After touching that low, price bounced and is now stabilizing around 2.55.
Selling pressure has slowed, but buyers are still cautious.
🔍 Short-Term View (15m – 1h)
Price is below short EMAs, showing short-term weakness
Momentum indicators are mixed, not fully oversold
2.45–2.40 is the nearest support area
Holding above this zone keeps the structure stable.
⏳ Mid-Term View (4h)
Trend is bearish to neutral
Strong resistance sits around 2.70–2.80
A real
IP-8,89%
- Reward
- like
- Comment
- Repost
- Share
🔹 ETH breaks below $3,200 — is this a short-term panic flush or a signal of trend reversal?
767
- Reward
- like
- Comment
- Repost
- Share
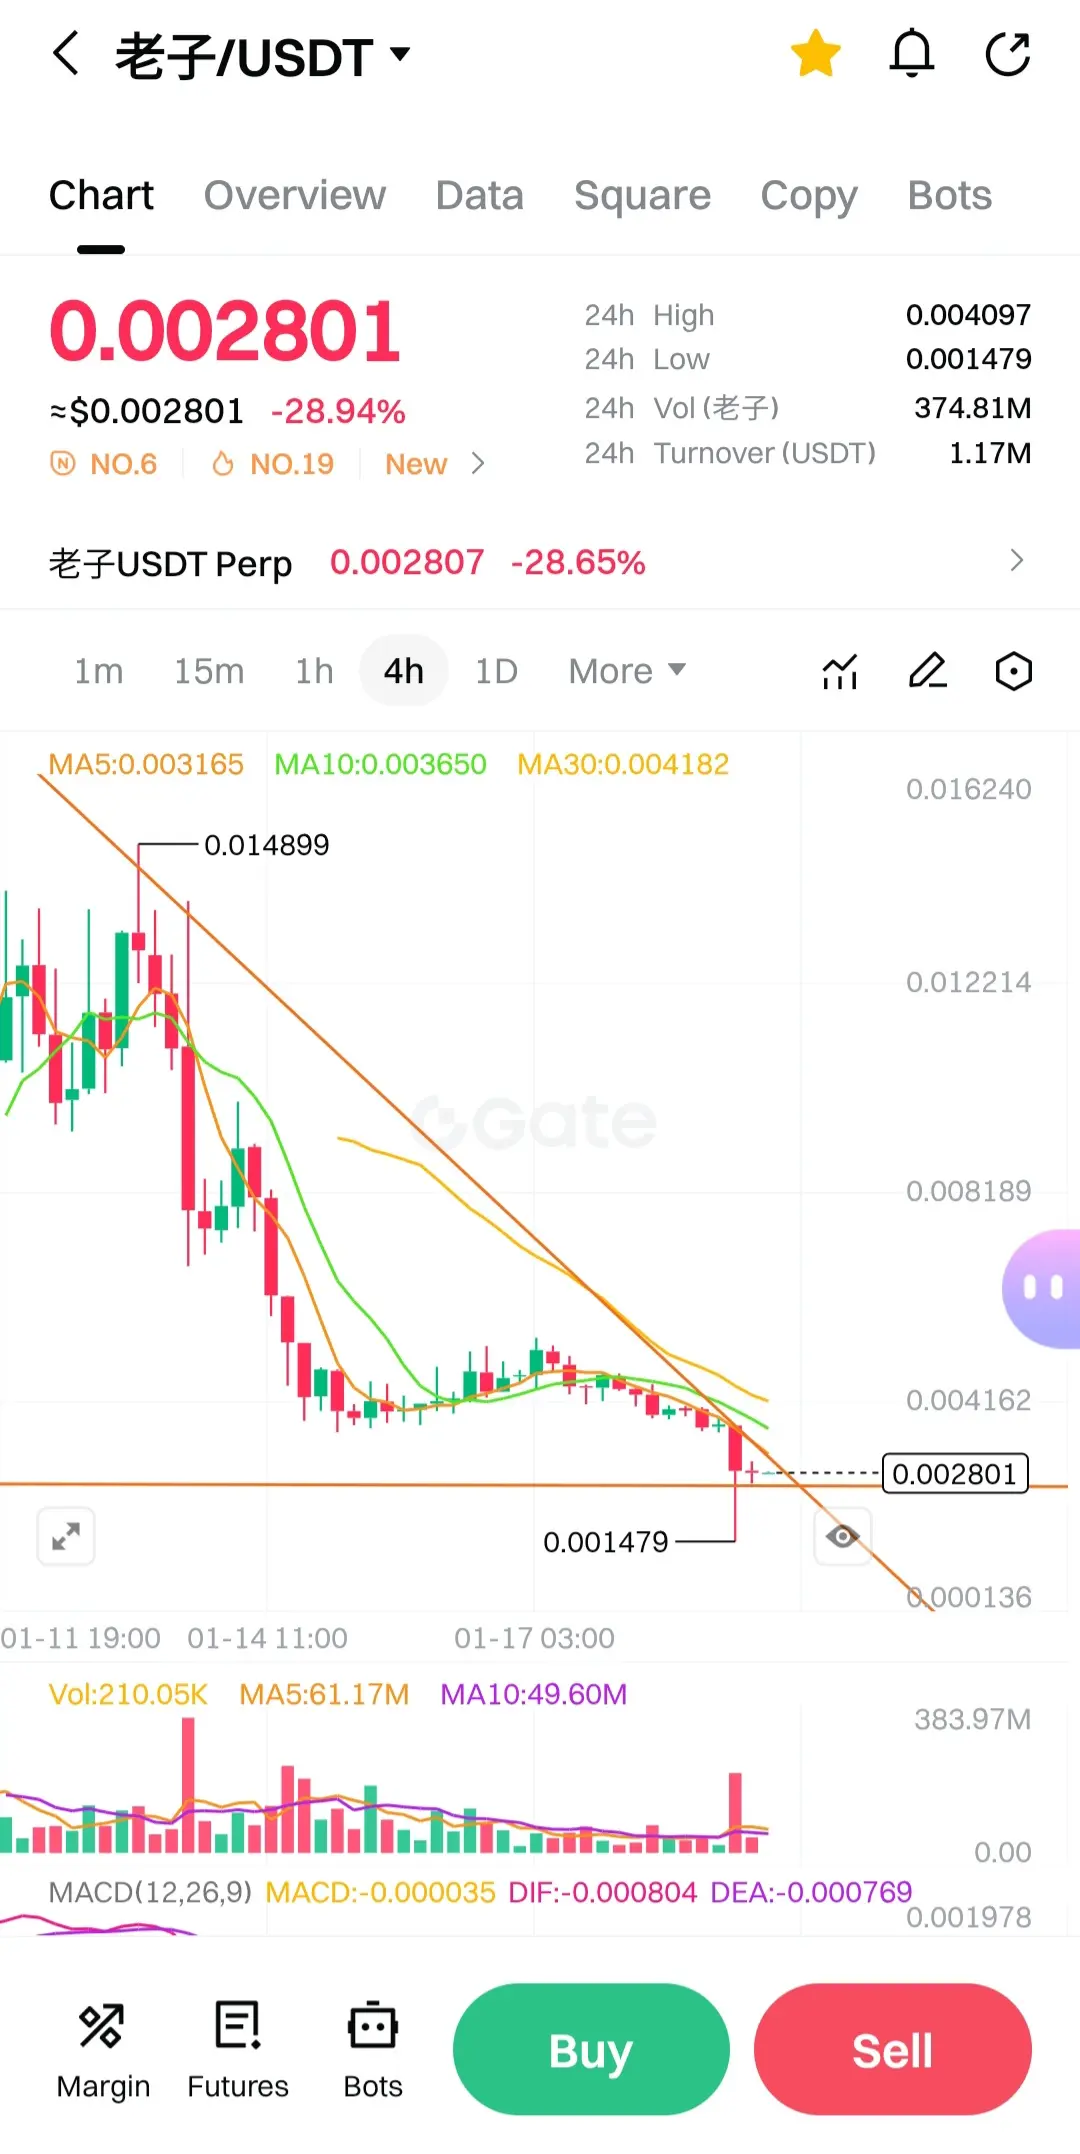
$老子
If it doesn’t bounce from here, it’s dead. I’m reopening my short position based on this chart.
A move above 0.003 means recovery, but if it breaks below 0.0025, it’s the death signal…
If the 0.003 level is broken and price holds above it, I won’t open any more positions.
If the price comes back to 0.0027, I’ll open a short again.
老子-26,74%
- Reward
- 1
- 1
- Repost
- Share
TenMillionUAndThenStop.:
It's already in a downtrend; it's probably going to fall further.
- Reward
- 1
- 1
- Repost
- Share
deltapro:
Amid record activity on the Ethereum blockchain, transaction costs dropped to a historic low of $0.15. 💪 A clear result of the developers' efforts to scale the network in recent years.
$ASTER ASTER saw a sharp drop recently and is now trying to stabilize after that heavy sell-off. Price reacted strongly from the lower zone, which shows buyers are active near support, but recovery still looks slow and cautious.
What the chart is saying
Strong rejection from the lower area around 0.55, which is acting as a key support.
Price is still trading below major moving averages, so overall momentum remains weak.
Volume spike during the drop suggests panic selling may already be done.
Multi-timeframe view
Short-term: Price may move sideways between 0.60 – 0.66 as the market cools down
ASTER-12,06%


- Reward
- 1
- Comment
- Repost
- Share
Lately, I don't know if you can feel it, but we are in an era where practical experience and win rate are king. The direction is truly too important, and those who are willing to take action will always be the winners.
#欧美关税风波冲击市场 #加密市场回调 #GateLaunchpadIMU
View Original#欧美关税风波冲击市场 #加密市场回调 #GateLaunchpadIMU


- Reward
- like
- Comment
- Repost
- Share
Load More
Join 40M users in our growing community
⚡️ Join 40M users in the crypto craze discussion
💬 Engage with your favorite top creators
👍 See what interests you
Trending Topics
View More5.02K Popularity
326.16K Popularity
36.66K Popularity
2.02K Popularity
1.85K Popularity
News
View MoreHuang Licheng continues to reduce HYPE long positions and increase ETH long positions, with a loss of approximately $1.87 million in the past day.
1 m
A certain whale is bullish on the future market and is simultaneously going long on BTC and HYPE
2 m
Immunefi(IMU) will be launched on the Gate Instant Exchange platform on January 22, supporting one-click exchange for 2200 cryptocurrencies.
19 m
Japanese Prime Minister: Dissolving the House of Representatives on January 23 and holding early elections
27 m
SNP500 rose 2535.68% after launching Alpha, current price 0.0024177 USDT
43 m
Pin