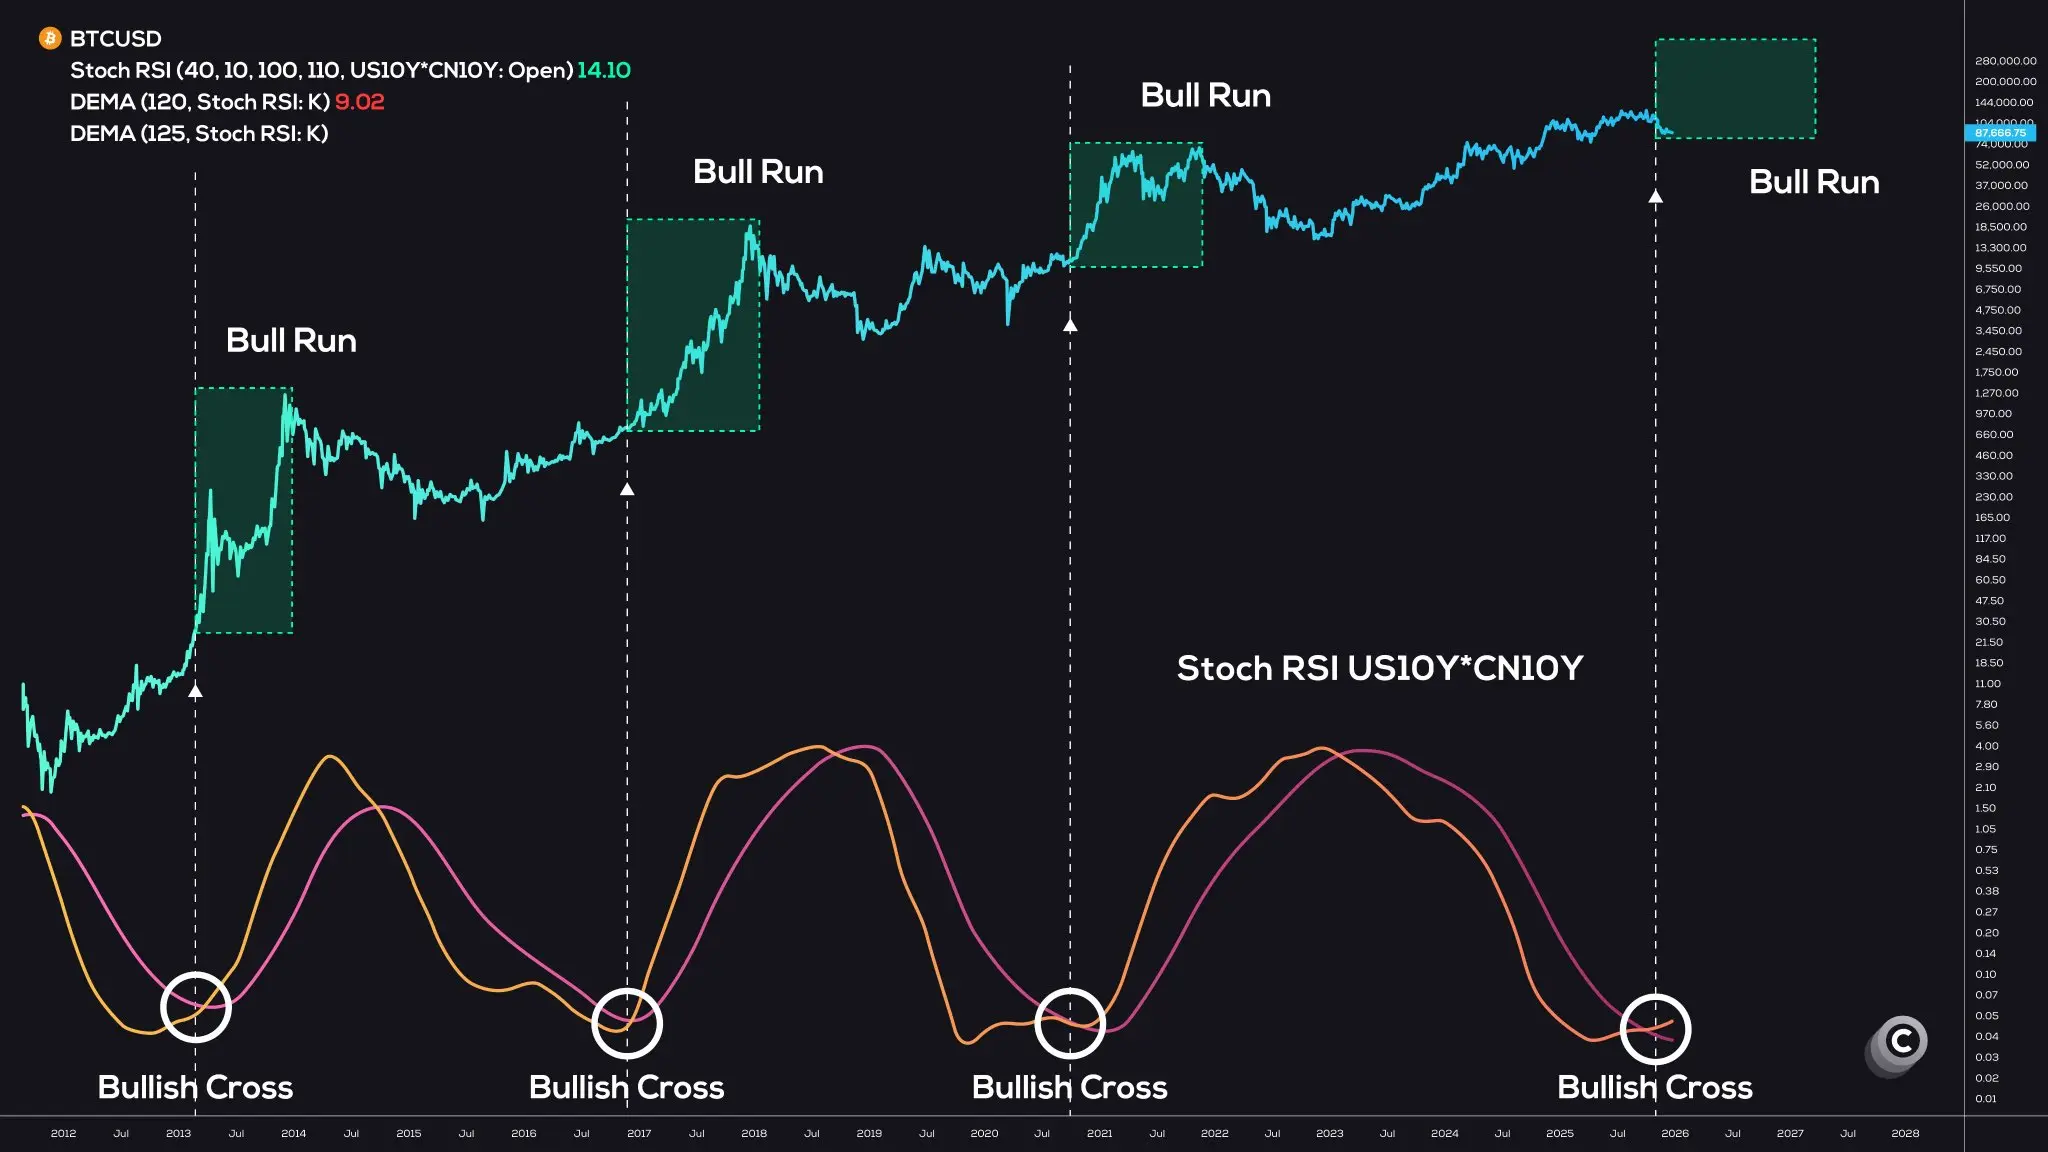
Multiple analysts have pointed out that the “most accurate bull market signal” for Bitcoin has appeared: the Stochastic RSI bullish crossover of the 10-year US and Chinese government bond yields. This is the fifth time it has triggered. In the past four instances, it led to significant Bitcoin rallies, indicating that liquidity improvements will drive risk assets to rebound. However, after rate cuts, gold surged dramatically while Bitcoin did not rise but instead fell.
Stochastic RSI Crossover Unveils Global Liquidity Turning Point
(Source: Trading View)
This signal has only appeared four times in history; the most recent occurrence is the fifth. Each previous trigger has resulted in large-scale Bitcoin price increases. But what exactly does this signal mean? We need to break down its components and the macro logic behind it.
The Stochastic RSI (Stochastic Relative Strength Index) is an enhanced version of RSI, more sensitive and better at capturing “momentum reversals.” The regular RSI, called the Relative Strength Index, measures whether the market is “hot” or “cold”: overbought levels suggest potential declines, oversold levels suggest rebounds. The Stochastic RSI further calculates whether the momentum of this return rate itself is starting to rebound from “too steep downward moves.”
A bullish crossover is like a green light—momentum shifts from “weak/downward” to “upward,” implying that this yield might be about to fall from high levels or at least stop rising sharply.
US10Y (U.S. 10-year Treasury yield) reflects long-term interest rates in the U.S., closely related to economic growth, inflation expectations, and monetary policy. CN10Y (China 10-year government bond yield) reflects China’s long-term interest rate environment, linked to its economic conditions and monetary policy.
Thus, these two yields represent the “long-term borrowing costs” of the world’s two largest economies (U.S. + China). When both countries’ long-term yields simultaneously shift from “weak” to “strong” (Stoch RSI bullish crossover), it often signals that the global interest rate environment is transitioning from “tight/high yield” to “loose/declining yield.” Simply put: global money is starting to become cheaper, and liquidity is improving!
Market Implications of the US-China 10-Year Bond Yield Cross
Interest rate turning point confirmed: synchronized decline in long-term borrowing costs in both countries indicates improved liquidity environment.
Risk appetite warms: low interest rates encourage investors to allocate to high-risk, high-return assets.
Capital reallocation: funds flow from fixed income into stocks, cryptocurrencies, and other risk assets.
This synchronized momentum shift is more convincing than a change in a single country’s rates. If only the U.S. cuts rates while China tightens, the global liquidity improvement is limited. But when both economies’ 10-year yields shift in tandem, it suggests systemic improvement in global financial conditions—most favorable for Bitcoin and other risk assets.
Why This Signal Is Highly Correlated with Bitcoin
Bitcoin is the “king of risk assets,” highly volatile and resilient. When liquidity loosens, it often outperforms stocks and gold. Historical beta coefficients show Bitcoin’s sensitivity to liquidity changes far exceeds traditional assets. When central banks ease monetary policy and rates fall, investors seek high-yield assets, and Bitcoin, with its limited supply and decentralization, tends to benefit most from liquidity improvements.
Historically, each occurrence of this signal has coincided with the Fed’s aggressive easing and global stimulus measures—money flooding the system. After the four previous instances of the 10-year yield crossover, Bitcoin experienced: a surge to nearly $20,000 at the end of 2017, a rebound from $3,000 to $13,000 in 2019, the start of a bull run reaching $69,000 in 2020, and a bottom rebound in 2023. The repeatability of this pattern has earned it the nickname “the most accurate bull market indicator.”
Now, with the “fifth” crossover just emerging, it suggests that the global interest rate turning point may be here, liquidity is set to loosen, and risk appetite is poised to recover. Technically, the Stochastic RSI crossing upward from oversold territory is an early warning of trend reversal. Coupled with the synchronized shift of the two largest economies, this signal’s reliability could be higher.
However, it’s important to note that this signal is not a magic button guaranteeing immediate Bitcoin price increases. It signals macro environment improvement, but actual price reactions may lag by weeks or months. Investors should view it as a medium- to long-term reference rather than a short-term trigger.
The Strange Divergence: Gold Rises, Bitcoin Falls After Rate Cuts
Since the Fed began rate cuts in Q3 last year, gold, silver, and US stocks surged, but cryptocurrencies like Bitcoin did not rise but instead fell. This divergence is extremely rare historically because, in theory, rate cuts should benefit all risk assets. Why did Bitcoin not follow the traditional liquidity logic this time?
One explanation is time lag. Historically, Bitcoin’s response to macro changes is slower than gold and other traditional assets. Gold, as a centuries-old safe haven, has mature institutional allocation pathways and quick capital inflows. Although Bitcoin is called “digital gold,” institutional adoption is still in early stages, with narrower capital channels. When macro conditions improve, funds may first flow into gold, and only after traditional assets rally sufficiently will capital rotate into Bitcoin.
Another explanation involves structural factors. Since H2 2025, the crypto market has experienced multiple regulatory crackdowns and exchange failures, damaging market confidence. Even with macro liquidity improving, if micro-market structures are impaired, funds may remain on the sidelines. Additionally, although Bitcoin ETFs have been approved, capital inflows are below expectations, reflecting cautious institutional risk appetite.
Recently, media outlets have been promoting gold and silver, while US-listed companies are quietly increasing Bitcoin holdings. This divergence indicates a disconnect between smart money and market sentiment. When media hype is high for gold, it often signals the late stage of a rally. Conversely, pessimism about Bitcoin can be an ideal long-term entry point. The adage “buy when no one is watching, sell when everyone is talking” is once again validated.
Can the Fifth Cross Repeat Past Bull Runs?
This signal has only appeared four times in history, each triggering a major Bitcoin rally: late 2017, when Bitcoin surged from thousands to nearly $20,000; 2019, from $3,000 to $13,000; 2020, initiating the most explosive bull run to $69,000; and 2023, from around $15,000 bottom to a new high.
Will history repeat with the fifth occurrence? Supporting arguments include: the synchronized shift in interest rate momentum in both major economies; continued institutional accumulation indicating smart money’s contrarian stance; and the established infrastructure for Bitcoin ETFs, making institutional capital inflows more accessible.
However, challenges exist. The current macro environment differs from previous cycles: inflation, though retreating, remains above targets; geopolitical risks have increased; regulatory uncertainties persist. These factors could delay Bitcoin’s response to liquidity improvements. Also, increased market maturity may reduce volatility, making past multi-fold gains harder to replicate.
From a risk-reward perspective, current positioning in Bitcoin remains attractive. If the 10-year yield crossover truly triggers liquidity easing, Bitcoin, as a highly elastic asset, will benefit significantly. Even if gains are smaller than in previous cycles, current prices still justify strategic allocation. The key is to control position sizes, avoid excessive leverage, and remain patient for macro improvements to materialize.