
Key Takeaways
-
Monad (MON) has dropped nearly 41% over the past two months but is showing early signs of stabilization.
-
Price action suggests a potential double bottom pattern forming near the $0.018 support zone.
-
Buyers have repeatedly defended the same support level, hinting at fading selling pressure.
-
A move above the 50-day moving average could strengthen the short-term bullish outlook.
-
A confirmed breakout above the $0.02970 neckline may open the door for a stronger recovery rally.
Monad (MON), the native token of the Monad Layer-1 blockchain, has been under pressure in recent weeks. The token is down roughly 41% over the past 60 days, driven by a slowdown in TVL growth and a decline in application-level revenue across the ecosystem.
However, sentiment may be starting to shift. MON posted a 12% bounce today, and more importantly, its price structure on the daily chart is beginning to show early signs of a bullish reversal — suggesting the downside momentum could be losing steam.
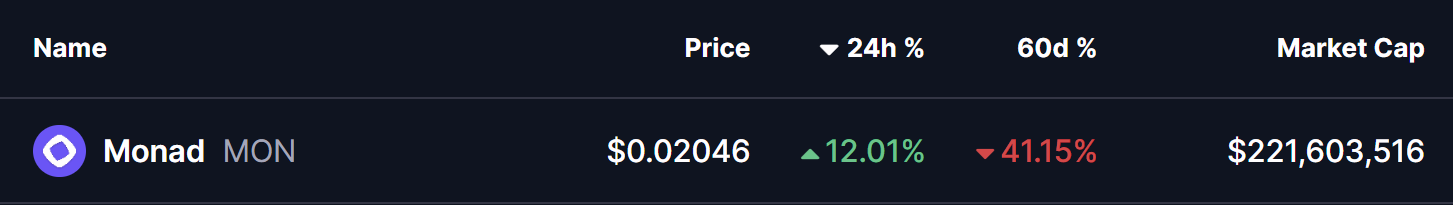
Source: Coinmarketcap
Double Bottom Pattern in Play
On the daily timeframe, MON appears to be forming a potential double bottom pattern, a classic bullish reversal structure that often develops near the end of extended downtrends.
The first bottom was formed when MON dropped toward the $0.018 support zone, followed by a rebound that carried price back toward the neckline resistance near $0.02970. That recovery attempt was rejected, sending MON back down to retest the same support level.
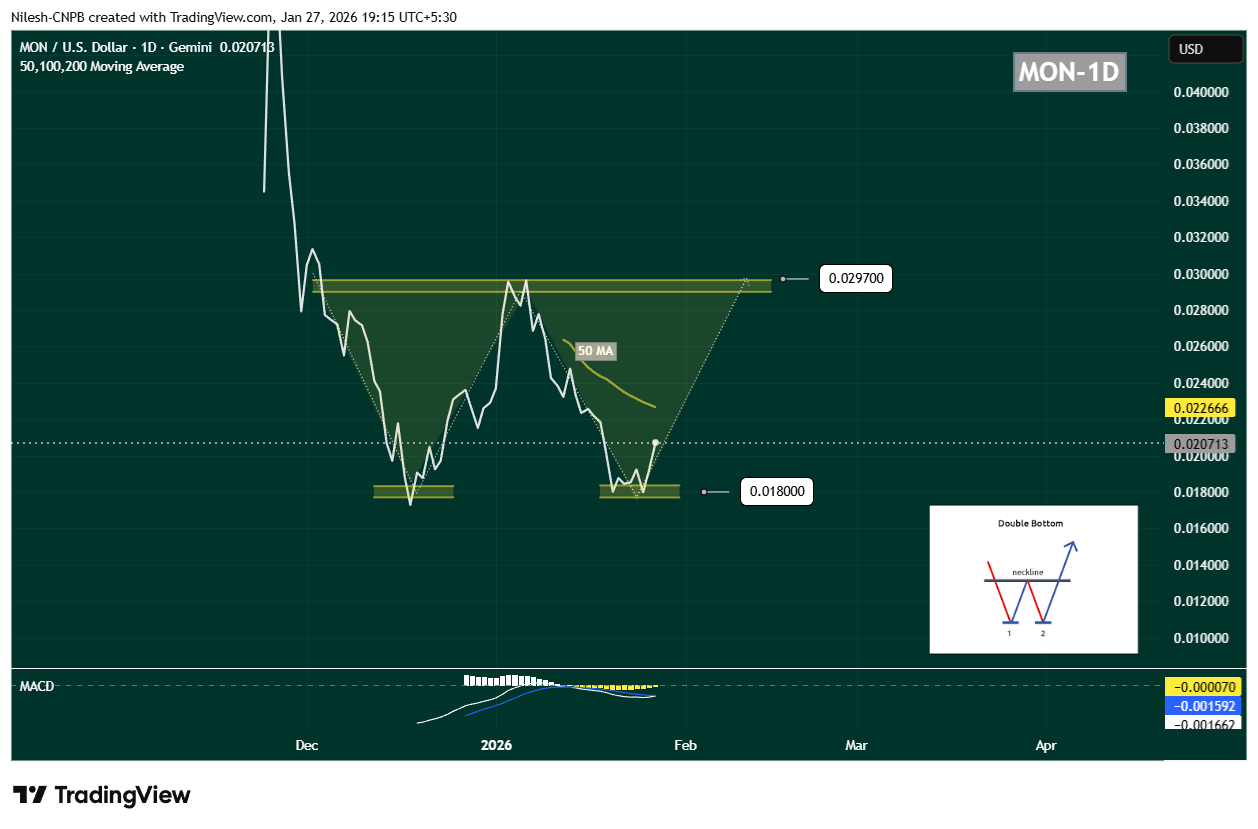
Monad (MON) Daily Chart/Coinsprobe (Source: Tradingview)
What’s notable this time is buyer behavior. Once again, demand emerged around $0.018, preventing a breakdown and forming the second bottom of the structure. MON is currently trading near $0.02071, indicating that selling pressure may be fading.
Momentum indicators are starting to support this view. The MACD is showing early signs of a potential bullish crossover, often seen as an initial signal that downside momentum is weakening and buyers may be preparing to step back in.
What’s Next for Monad (MON)?
For this bullish setup to gain credibility, MON needs to reclaim the 50-day moving average, which is currently positioned near $0.02266. A sustained move above this level would signal a shift in short-term momentum and improve the probability of a recovery rally.
If buyers manage to push price back toward the $0.02970 neckline, the market will be watching closely. A decisive breakout above this resistance, ideally followed by a successful retest, would confirm the double bottom pattern and open the door for a stronger upside move.
On the downside, the $0.018 support zone remains the most critical level to defend. A breakdown below this area would invalidate the bullish structure and likely expose MON to another leg of downside or extended consolidation.
Bottom Line
Despite recent weakness, MON’s technical structure is starting to look constructive. The repeated defense of identical lows, the emergence of a double bottom pattern, and improving momentum signals suggest that Monad could be approaching a potential turning point.
If key support continues to hold and the token reclaims its short-term moving averages, MON may be setting the stage for a recovery phase — especially if broader market conditions stabilize in the days ahead.
Disclaimer: The views and analysis presented in this article are for informational purposes only and reflect the author’s perspective, not financial advice. Technical patterns and indicators discussed are subject to market volatility and may or may not yield the anticipated results. Investors are advised to exercise caution, conduct independent research, and make decisions aligned with their individual risk tolerance.
About Author: Nilesh Hembade is the Founder and Lead Author of Coinsprobe, with over 5 years of experience in the cryptocurrency and blockchain industry. Since launching Coinsprobe in 2023, he has been providing daily, research-driven insights through in-depth market analysis, on-chain data, and technical research.
Disclaimer: The information on this page may come from third parties and does not represent the views or opinions of Gate. The content displayed on this page is for reference only and does not constitute any financial, investment, or legal advice. Gate does not guarantee the accuracy or completeness of the information and shall not be liable for any losses arising from the use of this information. Virtual asset investments carry high risks and are subject to significant price volatility. You may lose all of your invested principal. Please fully understand the relevant risks and make prudent decisions based on your own financial situation and risk tolerance. For details, please refer to
Disclaimer.
Related Articles
Bitcoin Short-Term Holders Discount Narrows to -5.7%, SOPR Signals Recovery
Gate News message, April 24 — Bitcoin short-term holders (STH) are showing signs of recovery as their discount narrowed from -21.6% to -5.7%, according to on-chain analyst Axel Adler Jr. The STH-SOPR (Spent Output Profit Ratio) 7-day moving average has climbed back above 1.0, indicating that short-t
GateNews5m ago
ARK Invest Report: Bitcoin confident buyers increased their holdings by 69%, and the bottom range hasn’t been tested yet
According to the Q1 2026 Bitcoin Quarterly Report released by ARK Invest on April 24, the holdings of Bitcoin “confidence buyers” increased from 2.13 million BTC to 3.60 million BTC, up 69% quarter-over-quarter. ARK Invest said that the key support range for the cyclical bottom as defined by the firm ($54,000 to $50,000) was not tested by the end of the first quarter.
MarketWhisper46m ago
XRP Price Eyes Final Resistance at $1.53 — Breakdown Risk Toward $0.87 Looms
XRP approaches $1.53 resistance as Wave E nears completion
$1.39 support must hold to maintain bullish structure
Rejection could push XRP down toward $1.09 to $0.87
Ripple’s XRP has reached a decisive moment that traders cannot ignore. Price action now approaches a critical resistance
CryptoNewsLand53m ago
Bitcoin Stalls at $77.8K Amid Japan Inflation Surge and Iran War Tensions
Gate News message, April 24 — Crypto markets weakened on Friday as Bitcoin hovered near $77,800 and Ethereum fell to $2,300 with a 24-hour decline of 0.8%. The uptrend that began Wednesday from $65,000 has visibly slowed, with Ethereum underperforming Bitcoin.
Market pressure stems from Japan's Mar
GateNews3h ago
Gate Daily Report (April 24): US Treasury sanctions Cambodian crypto “pig butchering” scams; Tether mints an additional 1 billion USDT
Bitcoin (BTC) rebound momentum is weakening, with a temporary quote around $78,030 as of April 24. The U.S. Treasury Department’s Office of Foreign Assets Control (OFAC) sanctioned a Cambodian politician linked to a crypto “pig butchering” scam center. Tether issued another 1 billion USDT on the Ethereum network; over the past 5 days, it has issued a total of 3 billion USDT on the Ethereum network.
MarketWhisper4h ago
Trump ordered the sinking of ships in the Strait of Hormuz, and Bitcoin’s rebound momentum weakened to 78k
U.S. President Donald Trump posted on Truth Social on April 24, announcing that the ceasefire agreement between Israel and Lebanon will be extended by three weeks. On the same day, he also ordered the U.S. Navy to “sink any vessel currently laying mines in the Strait of Hormuz,” and instructed the military to carry out mine-clearing operations with “three times the force.” Brent crude spot prices have returned above $100, and Bitcoin is trading near $78,000 under pressure and consolidating.
MarketWhisper5h ago