
Key Takeaways
-
SKY is forming a rounding bottom pattern on the daily chart
-
Price has rebounded strongly from the $0.0419 demand zone
-
Rising volume supports improving bullish momentum
-
A breakout above $0.0778 could confirm trend reversal
-
Pattern projection points toward the $0.11 region
Sky (SKY), the native governance and utility token of the Sky Protocol (formerly MakerDAO), has stepped into the spotlight after posting a strong daily move of over 8%, accompanied by a sharp 35% surge in trading volume. While the short-term momentum is drawing attention, the more compelling story is unfolding on the higher timeframe chart.
Source: Coinmarketcap
Price action is now forming a classic bullish reversal structure — one that often signals the transition from prolonged weakness into a new recovery phase.
Rounding Bottom Pattern Signals Trend Shift
On the daily timeframe, SKY appears to be completing a rounding bottom formation, a well-known bullish reversal pattern that typically develops after extended downtrends. This structure reflects a gradual shift in market psychology, where persistent selling pressure slowly fades and long-term accumulation begins to dominate.
Earlier in the trend, SKY faced repeated rejection near the $0.0778 neckline resistance, which triggered a steep sell-off. That decline ultimately bottomed near $0.0419, marking a critical demand zone where buyers aggressively stepped in and prevented further downside.
Since establishing this low, price action has steadily curved higher, forming a smooth rounded base. This gradual recovery — rather than a sharp V-shaped bounce — suggests healthier accumulation rather than short-term speculation.
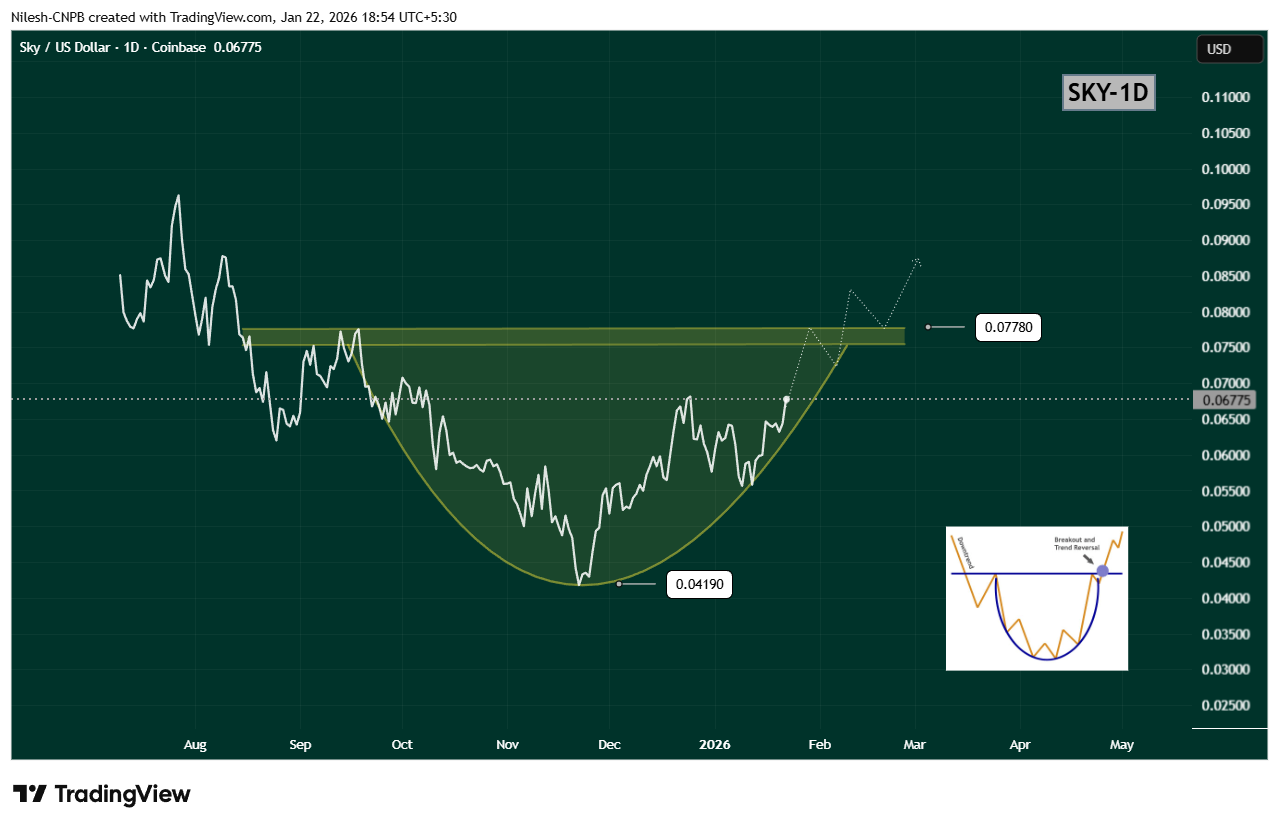
$SKY Daily Chart/Coinsprobe (Source: Tradingview)
Breakout Zone Comes Into Focus
Recent price action shows SKY reclaiming the $0.06933 region, a level that previously acted as resistance. This move strengthens the bullish structure and signals that buyers are gaining confidence ahead of a potential neckline test.
The key level to watch now is the $0.0778 resistance zone. A decisive daily close above this level would confirm the rounding bottom breakout and mark a clear shift in trend structure. Ideally, a breakout followed by a successful retest of this zone as support would further validate the bullish case.
Upside Projection and Risk Outlook
Based on the depth of the rounding bottom, the measured upside projection points toward the $0.11 region. Reaching this target would represent a potential 60–65% upside from current levels, aligning well with historical behavior of similar reversal patterns.
That said, patience remains important. Before any confirmed breakout, SKY could still experience short-term pullbacks or consolidation near the rising curve of the pattern. Such moves would not invalidate the bullish setup, as long as price continues to hold above recent higher lows.
A breakdown below the rounding base would weaken the structure, but for now, momentum favors the bulls.
Bottom Line
SKY is showing clear signs of a trend reversal in progress, with a rounding bottom pattern taking shape on the daily chart. Rising volume, improving structure, and a steady recovery toward neckline resistance all suggest that accumulation is underway.
If SKY can break and hold above $0.0778, the path opens toward the $0.11 region, signaling a broader bullish continuation. Until then, consolidation and minor pullbacks remain possible — but the overall structure is one that traders will be watching closely.
Disclaimer: The views and analysis presented in this article are for informational purposes only and reflect the author’s perspective, not financial advice. Technical patterns and indicators discussed are subject to market volatility and may or may not yield the anticipated results. Investors are advised to exercise caution, conduct independent research, and make decisions aligned with their individual risk tolerance.
About Author: Nilesh Hembade is the Founder and Lead Author of Coinsprobe, with over 5 years of experience in the cryptocurrency and blockchain industry. Since launching Coinsprobe in 2023, he has been providing daily, research-driven insights through in-depth market analysis, on-chain data, and technical research.
Disclaimer: The information on this page may come from third parties and does not represent the views or opinions of Gate. The content displayed on this page is for reference only and does not constitute any financial, investment, or legal advice. Gate does not guarantee the accuracy or completeness of the information and shall not be liable for any losses arising from the use of this information. Virtual asset investments carry high risks and are subject to significant price volatility. You may lose all of your invested principal. Please fully understand the relevant risks and make prudent decisions based on your own financial situation and risk tolerance. For details, please refer to
Disclaimer.
Related Articles
ARK Invest Report: Bitcoin confident buyers increased their holdings by 69%, and the bottom range hasn’t been tested yet
According to the Q1 2026 Bitcoin Quarterly Report released by ARK Invest on April 24, the holdings of Bitcoin “confidence buyers” increased from 2.13 million BTC to 3.60 million BTC, up 69% quarter-over-quarter. ARK Invest said that the key support range for the cyclical bottom as defined by the firm ($54,000 to $50,000) was not tested by the end of the first quarter.
MarketWhisper29m ago
XRP Price Eyes Final Resistance at $1.53 — Breakdown Risk Toward $0.87 Looms
XRP approaches $1.53 resistance as Wave E nears completion
$1.39 support must hold to maintain bullish structure
Rejection could push XRP down toward $1.09 to $0.87
Ripple’s XRP has reached a decisive moment that traders cannot ignore. Price action now approaches a critical resistance
CryptoNewsLand36m ago
Bitcoin Stalls at $77.8K Amid Japan Inflation Surge and Iran War Tensions
Gate News message, April 24 — Crypto markets weakened on Friday as Bitcoin hovered near $77,800 and Ethereum fell to $2,300 with a 24-hour decline of 0.8%. The uptrend that began Wednesday from $65,000 has visibly slowed, with Ethereum underperforming Bitcoin.
Market pressure stems from Japan's Mar
GateNews2h ago
Gate Daily Report (April 24): US Treasury sanctions Cambodian crypto “pig butchering” scams; Tether mints an additional 1 billion USDT
Bitcoin (BTC) rebound momentum is weakening, with a temporary quote around $78,030 as of April 24. The U.S. Treasury Department’s Office of Foreign Assets Control (OFAC) sanctioned a Cambodian politician linked to a crypto “pig butchering” scam center. Tether issued another 1 billion USDT on the Ethereum network; over the past 5 days, it has issued a total of 3 billion USDT on the Ethereum network.
MarketWhisper4h ago
Trump ordered the sinking of ships in the Strait of Hormuz, and Bitcoin’s rebound momentum weakened to 78k
U.S. President Donald Trump posted on Truth Social on April 24, announcing that the ceasefire agreement between Israel and Lebanon will be extended by three weeks. On the same day, he also ordered the U.S. Navy to “sink any vessel currently laying mines in the Strait of Hormuz,” and instructed the military to carry out mine-clearing operations with “three times the force.” Brent crude spot prices have returned above $100, and Bitcoin is trading near $78,000 under pressure and consolidating.
MarketWhisper5h ago
Crypto Fear and Greed Index Drops to 39, Market in Panic State
Gate News message, April 24 — The Crypto Fear and Greed Index dropped to 39 today, down from 46 yesterday, according to data from Alternative.me. The index indicates the market remains in a panic state.
GateNews5h ago