Over the past week, the price of Cardano (ADA) has increased by nearly 21%, and in the last 24 hours alone, it has risen by about 7%, making it one of the major coins with the most positive developments. This upward momentum was initially considered quite sustainable, as technical signals on the chart indicated an improving trend.
However, upon deeper analysis, the market picture becomes more complex. Although the overall trend still leans towards growth, momentum indicators suggest that the strength of the trend is gradually weakening. Instead of a sharp correction, current data indicate a high likelihood that ADA will enter a sideways accumulation phase before establishing its next direction. Below are detailed analyses of the market signals.
Uptrend maintained, but momentum decreasing on the 12-hour chart
On the 12-hour timeframe, ADA still maintains an uptrend structure. A notable positive signal is the upcoming crossover between the exponential moving averages (EMA), as the 20-period EMA approaches the 50-period EMA. This crossover often signals that the medium-term trend is being reinforced.
However, momentum indicators show signs of stagnation. From December 9 to January 6, ADA’s price was trending downward while the (RSI) increased. This is a hidden bearish divergence—often indicating weakening momentum, with potential short-term correction risks, rather than a trend reversal.
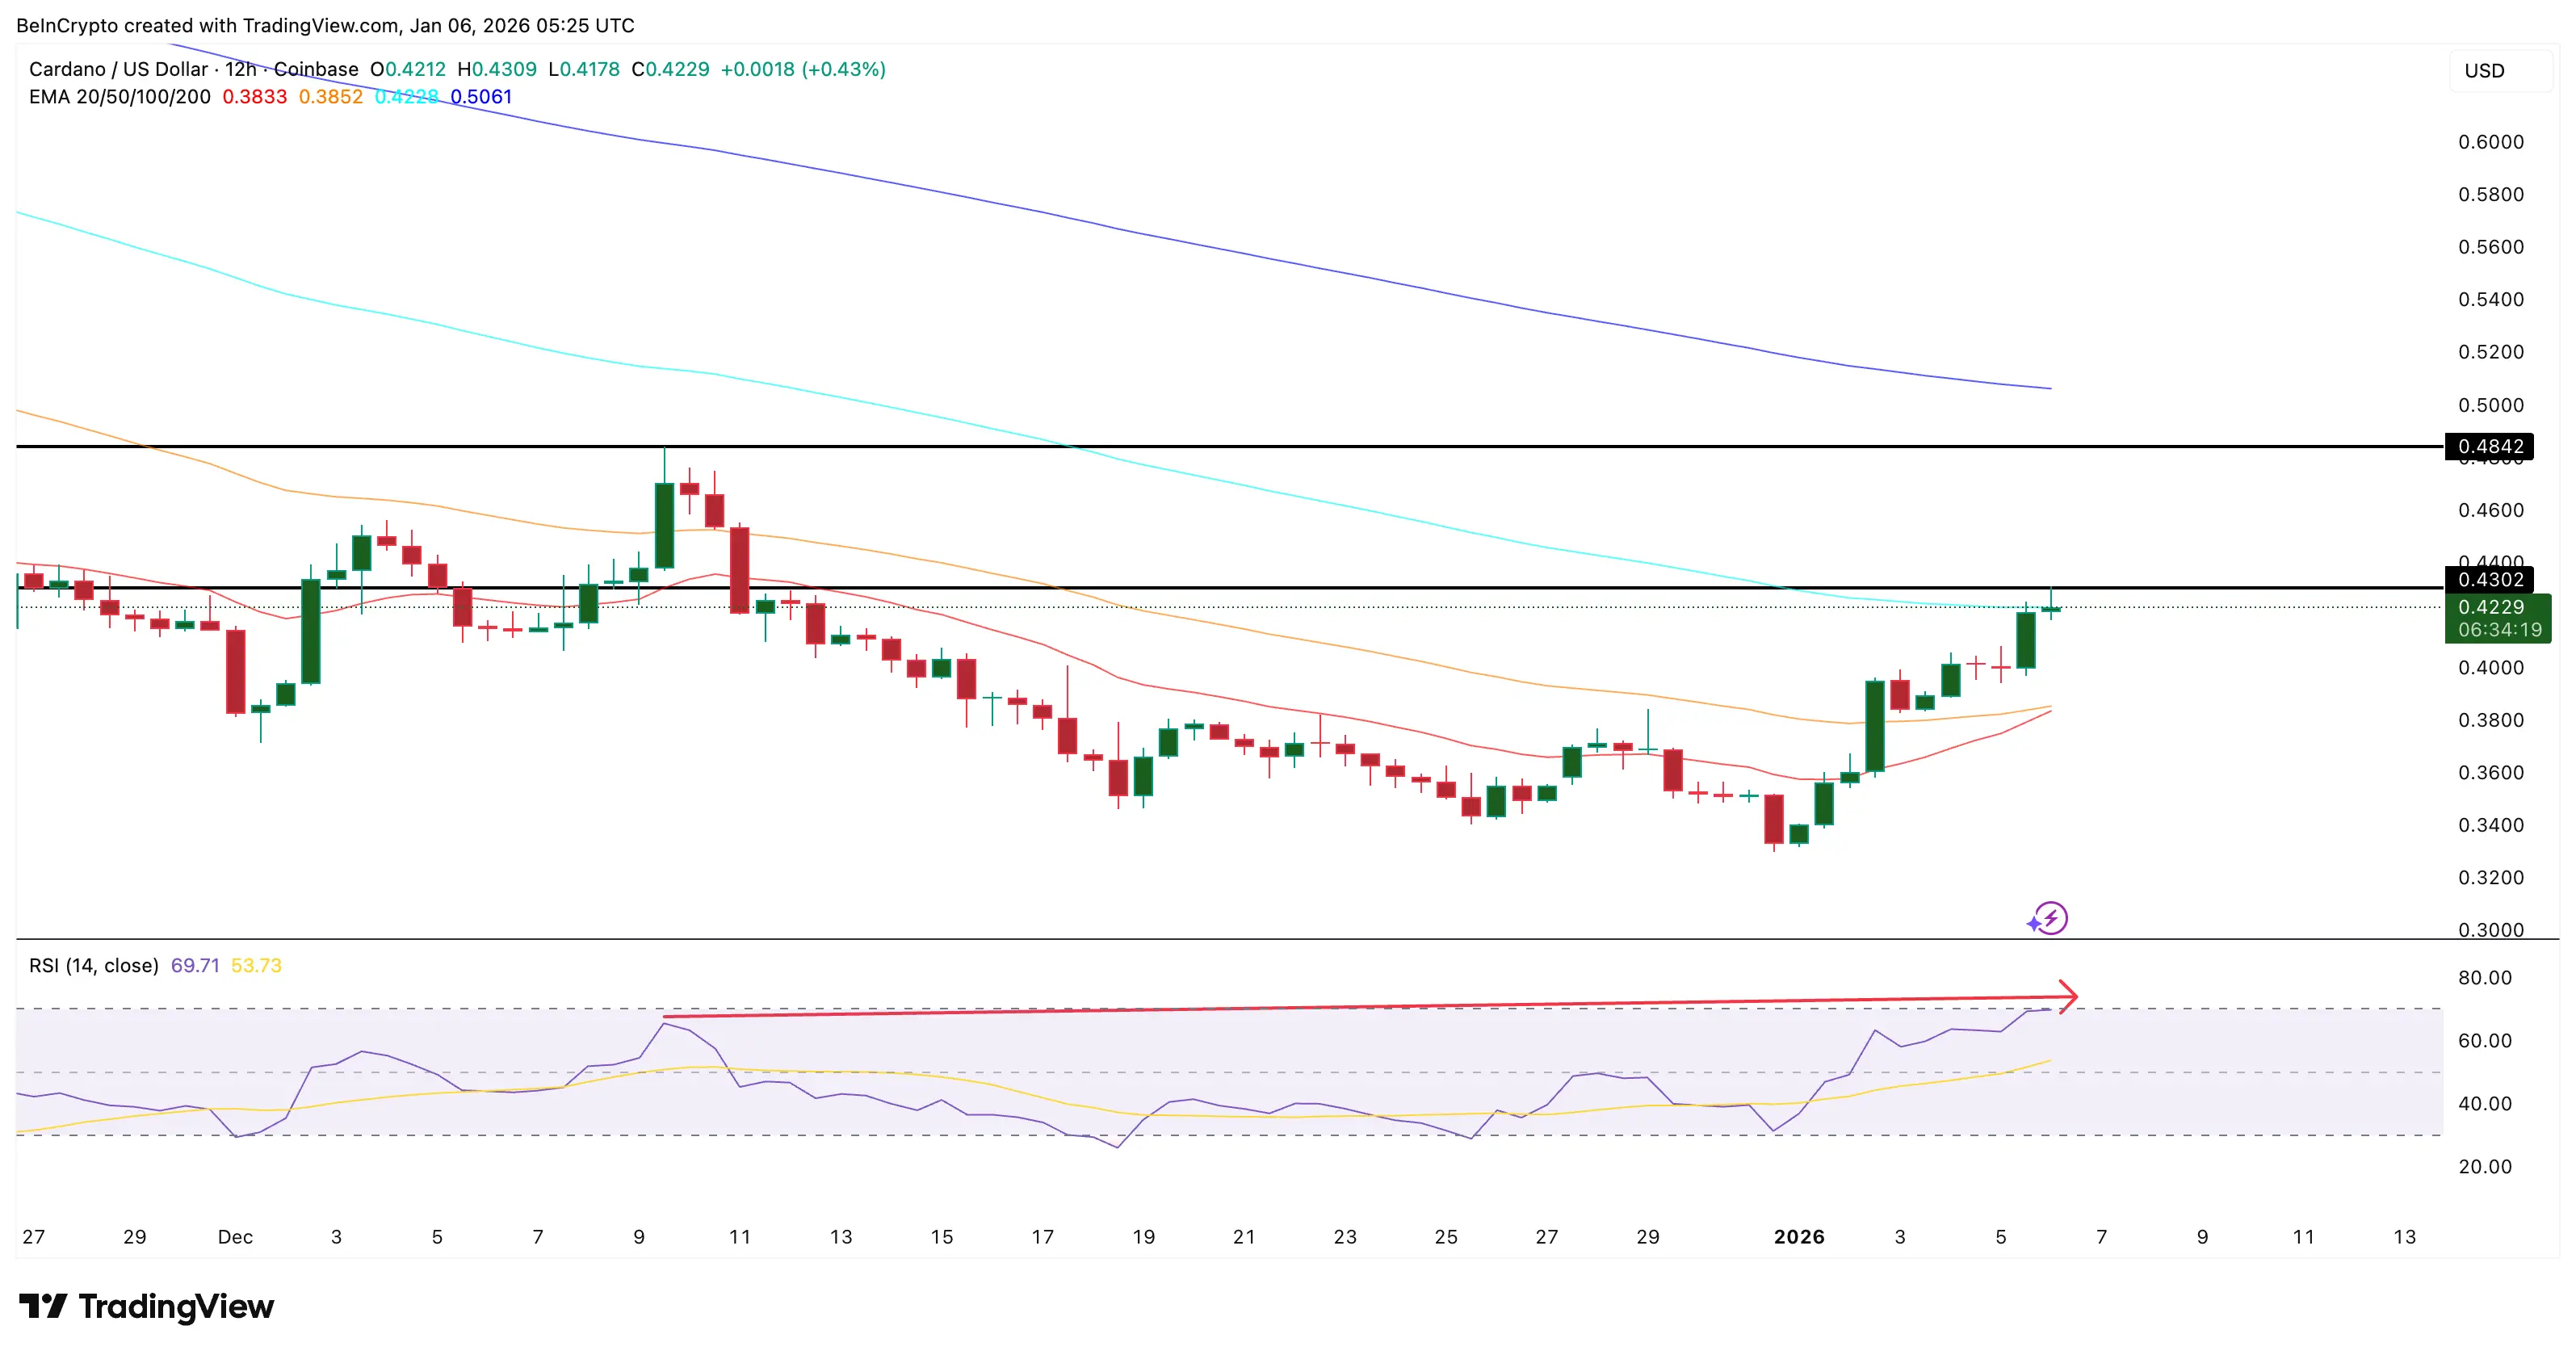 Conflicting indicators appear | Source: TradingView If the next candle of ADA forms below the $0.43 level, a lower high pattern will be confirmed, increasing the risk of correction.
In summary, the uptrend still exists, but the driving force has weakened. This combination often leads to an accumulation phase, moving sideways rather than continuing a strong rise or a sharp decline.
On-chain data: Patient investors, no signs of panic
On-chain indicators suggest the likelihood of a deep correction is quite low at this time.
The Spent Coins Age Bands index tracks the amount of ADA moved by investor groups with different holding periods. When this value decreases, it indicates that investors are holding onto their coins rather than selling.
The two most prominent groups are:
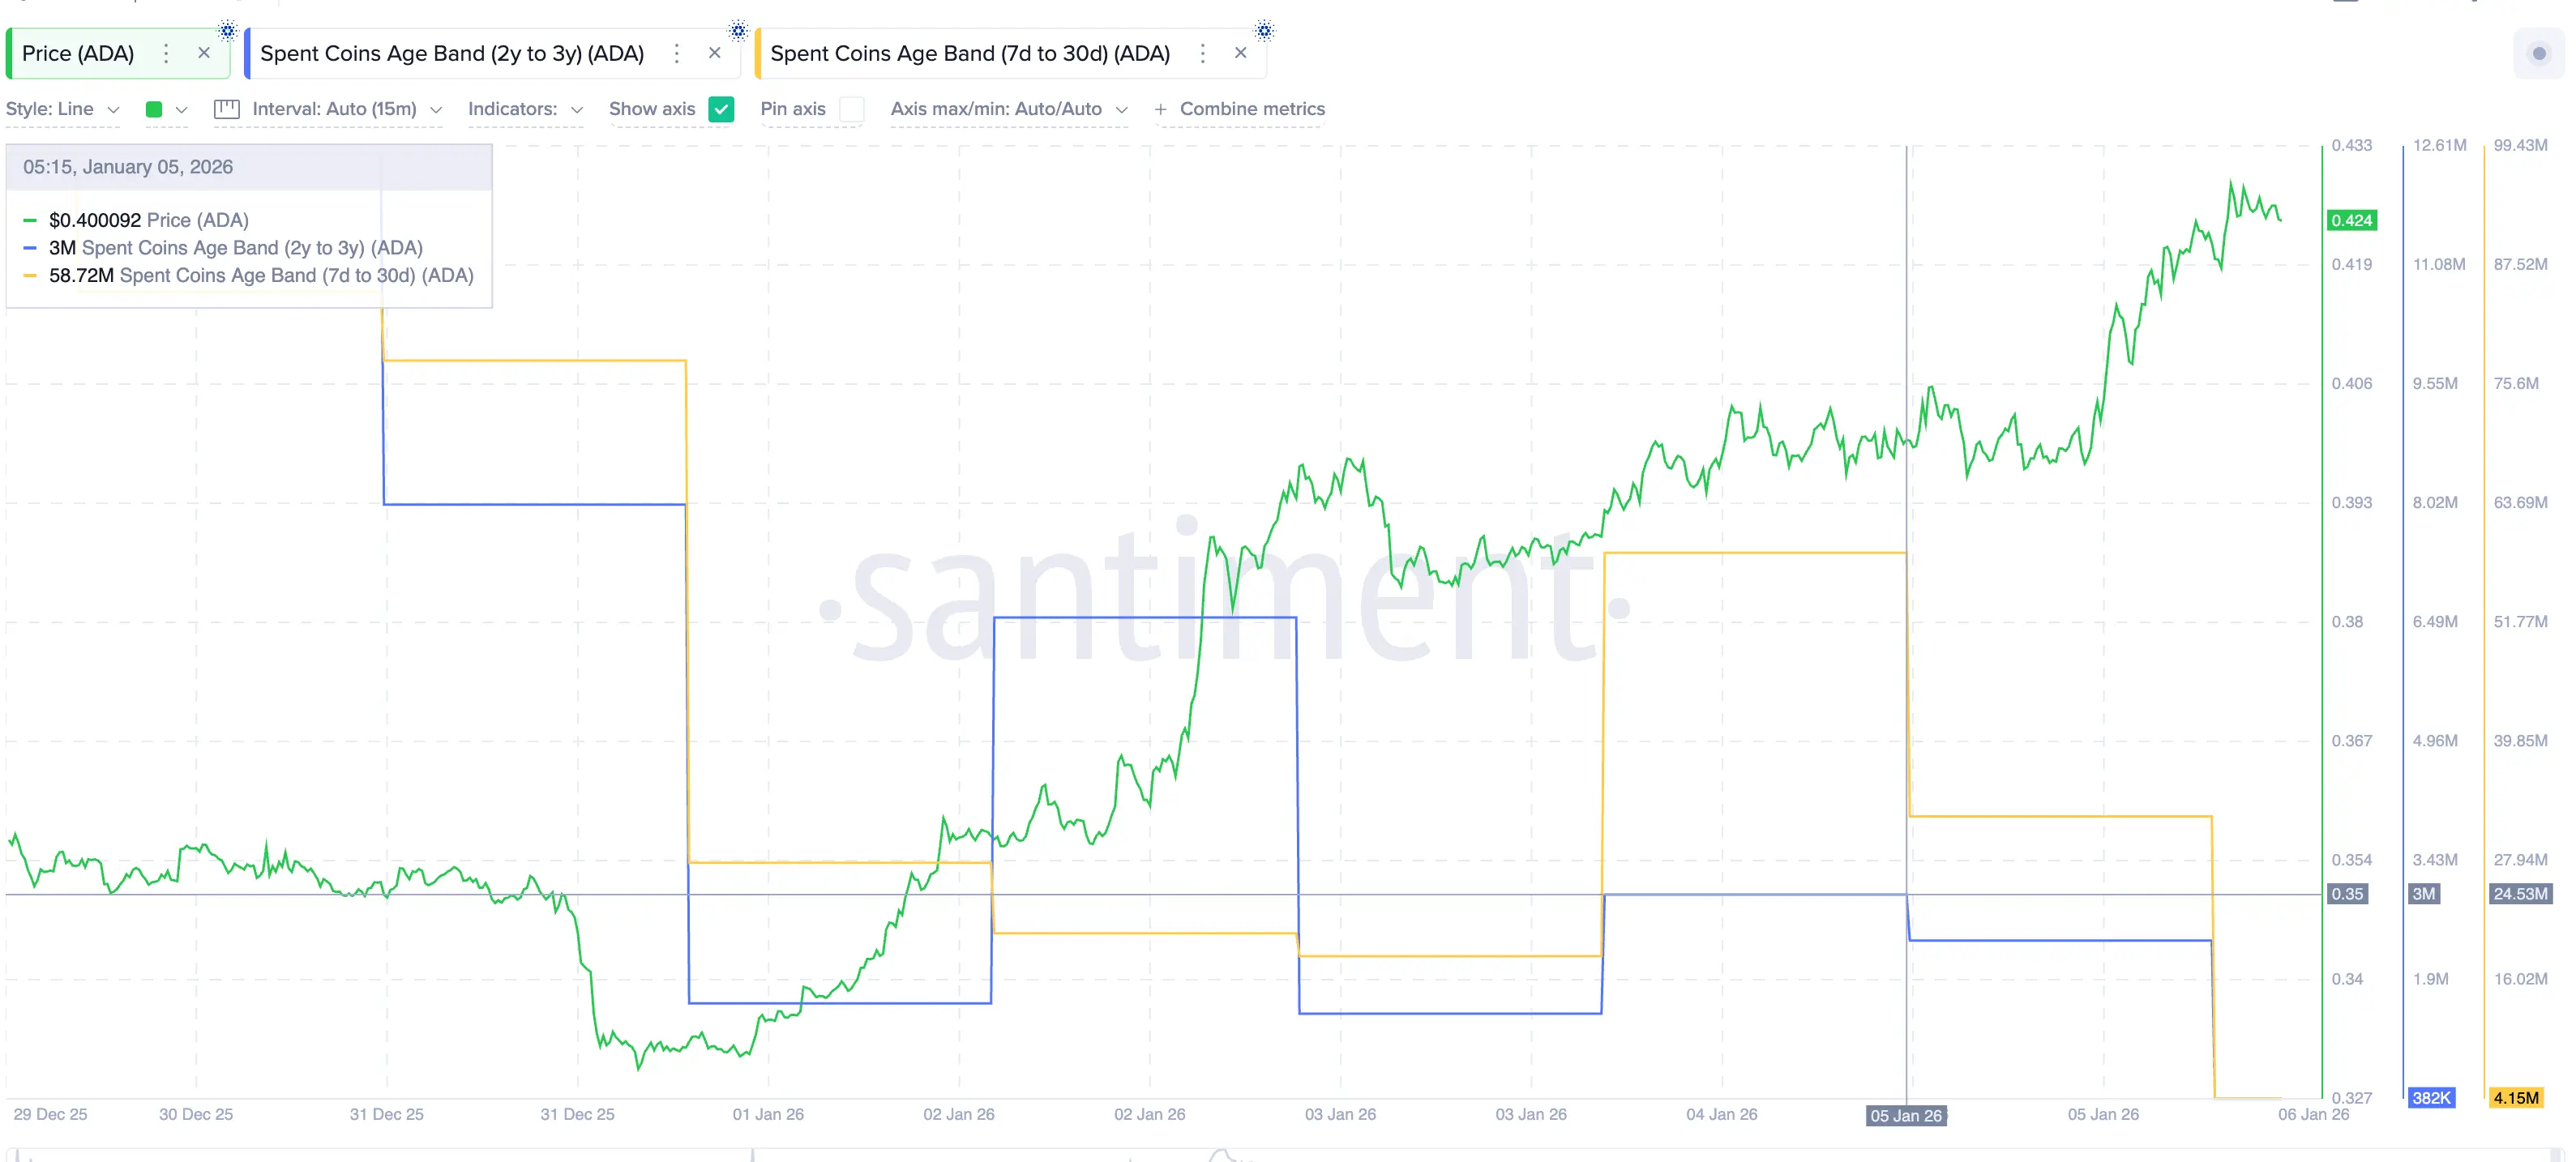 Slow transaction activity of ADA coins | Source: Santiment This shows that both short-term and long-term investors are choosing patience, with no signs of panic selling or strong profit-taking, even after the recent impressive rally.
When market momentum decreases but capital flow remains low, the market typically shifts into an accumulation state, trading within a narrow range rather than experiencing sharp declines.
Important ADA price levels: Trading range of 9%
In the context of weakening trend strength and momentum, price levels become particularly significant.
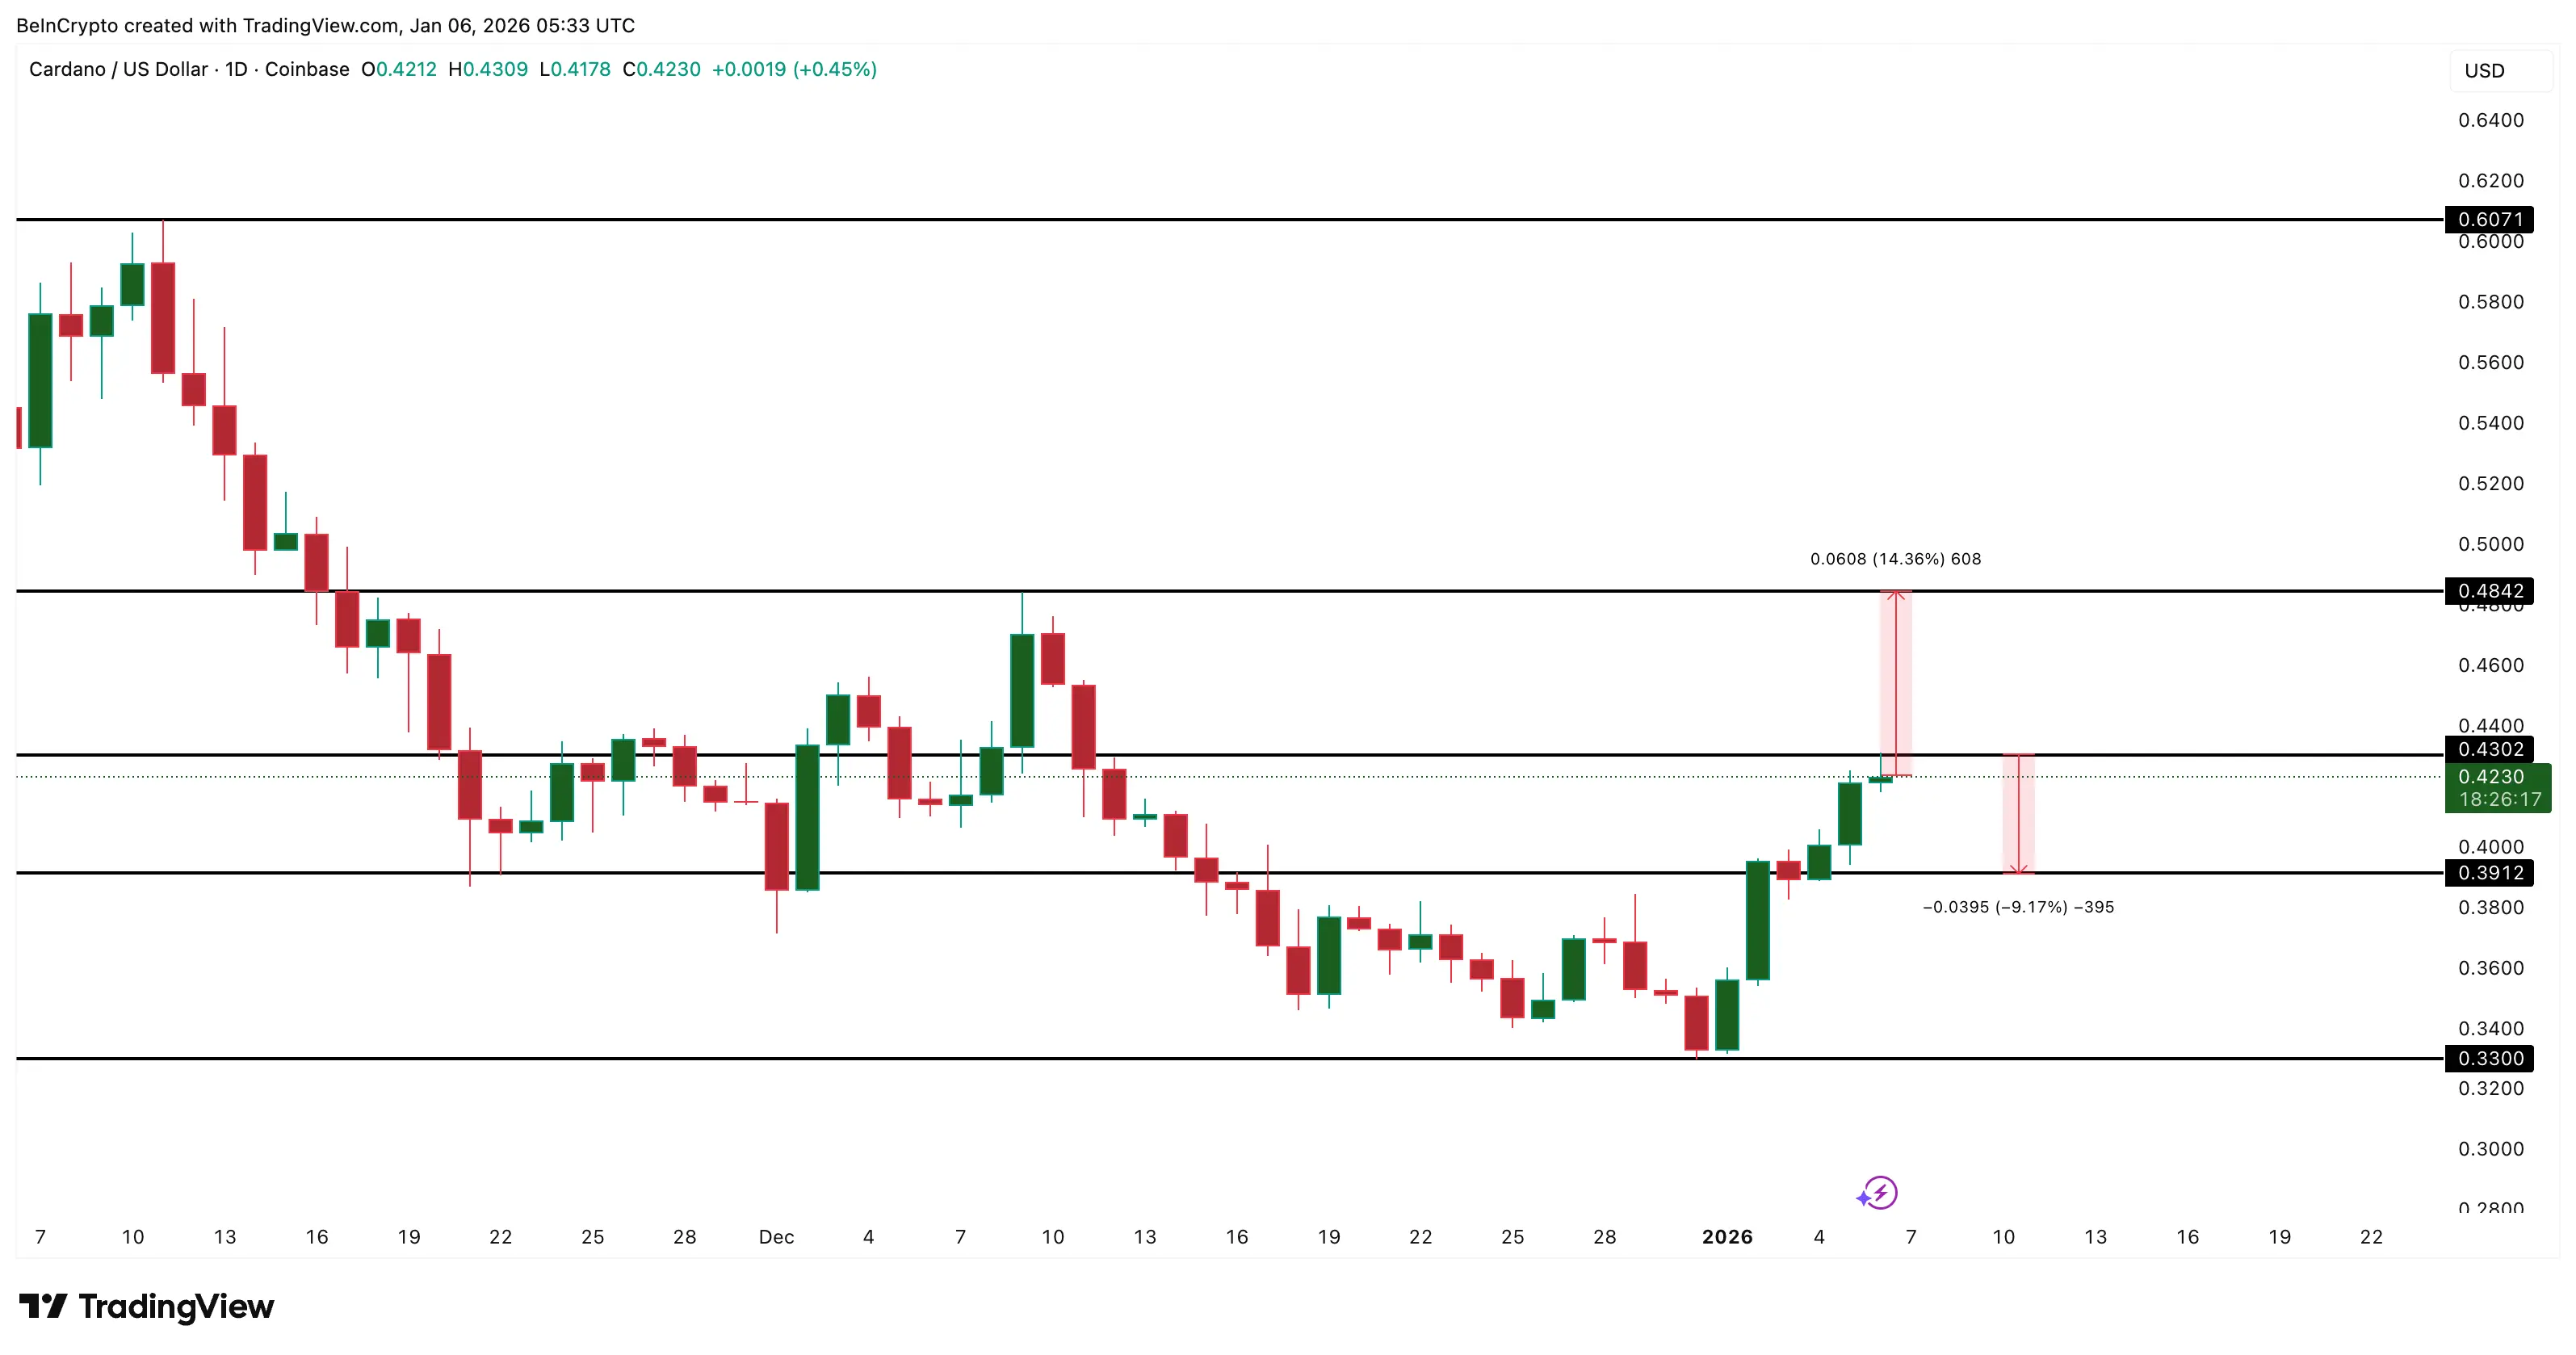 ADA price analysis | Source: TradingView Until one of these levels is broken, the most likely scenario is that ADA will trade within the range of $0.39 to $0.43, corresponding to about a 9% fluctuation.
This range accurately reflects the current market dynamics: the uptrend still exists, patient investors have not sold, but momentum needs time to reset before the next major move.
Disclaimer: The information on this page may come from third parties and does not represent the views or opinions of Gate. The content displayed on this page is for reference only and does not constitute any financial, investment, or legal advice. Gate does not guarantee the accuracy or completeness of the information and shall not be liable for any losses arising from the use of this information. Virtual asset investments carry high risks and are subject to significant price volatility. You may lose all of your invested principal. Please fully understand the relevant risks and make prudent decisions based on your own financial situation and risk tolerance. For details, please refer to
Disclaimer.
Related Articles
ZANO 4.6% gains 11.2% to $7.25, technical chart shows bullish rectangle pattern
Gate News reports that on March 19, ZANO token price surged rapidly to $7.25, up 11.2%, with trading volume rising in sync. Technical analysis shows ZANO exhibits a bullish rectangle pattern, with price entering a consolidation phase after the rapid surge, and market signs of buyer entry appearing.
GateNews7m ago
This Friday Traditional Financial Markets Welcome 'Quadruple Witching Day,' Bitcoin Volatility May Rise Accordingly
This Friday will see the quarterly derivatives event "Quadruple Witching Day," which may lead to increased market volatility. The current market environment is highly volatile, with the VIX index breaking through 35, and Bitcoin volatility is also likely to rise. Additionally, on March 27th, there is a large-scale derivatives expiration, which will intensify market volatility risks.
GateNews36m ago
XRP trading price is $1.43, and the RSI indicator shows oscillation in the neutral zone.
Gate News reported that on March 19, XRP is currently trading at $1.43, with a Relative Strength Index (RSI) of 49.65, sitting in the neutral zone. Technical analysis shows XRP price oscillating between the $1.40 support level and the $1.50 resistance level.
GateNews1h ago
ZANO Roars Back, Records 11.2% As Bullish Rectangle Structure Prints Continuing Market Rally: Ana...
Zano (ZANO) coin is experiencing a surge in price and trading volume, reaching $7.25. Analysts note a bullish rectangle pattern indicating sustained upward momentum, reflecting increased demand for privacy-focused cryptocurrencies amid broader market recovery.
BlockChainReporter1h ago
BTC rises 0.74% in 15 minutes: FOMC meeting digestion and short covering drive short-term volatility
Between 2026-03-19 15:45 to 16:00 (UTC), BTC experienced a 15-minute price range of 68787.0 to 69550.9 USDT, achieving a realized return rate of +0.74% with an amplitude of 1.11%. During the same period, market attention increased, short-term volatility intensified, and fund behavior and sentiment indicators both showed concentrated changes.
The primary driver of this price movement was the conclusion of the FOMC meeting, after which the market saw no new bearish catalysts. Some short sellers chose to cover their positions, providing upward momentum to the price in the short term. Additionally, while ETF fund outflows reflected institutional profit-taking, they did not form a sustained trading
GateNews1h ago
Aster (ASTER) Price Rejected Again at $0.80 – Is a Sharp Drop Next?
Aster (ASTER) is once again facing trouble at the $0.80 level, and the repeated rejection is starting to raise concerns. What once looked like a potential breakout is now turning into a clear area of resistance that the price simply can’t overcome.
This level has held firm since December,
CaptainAltcoin1h ago
