


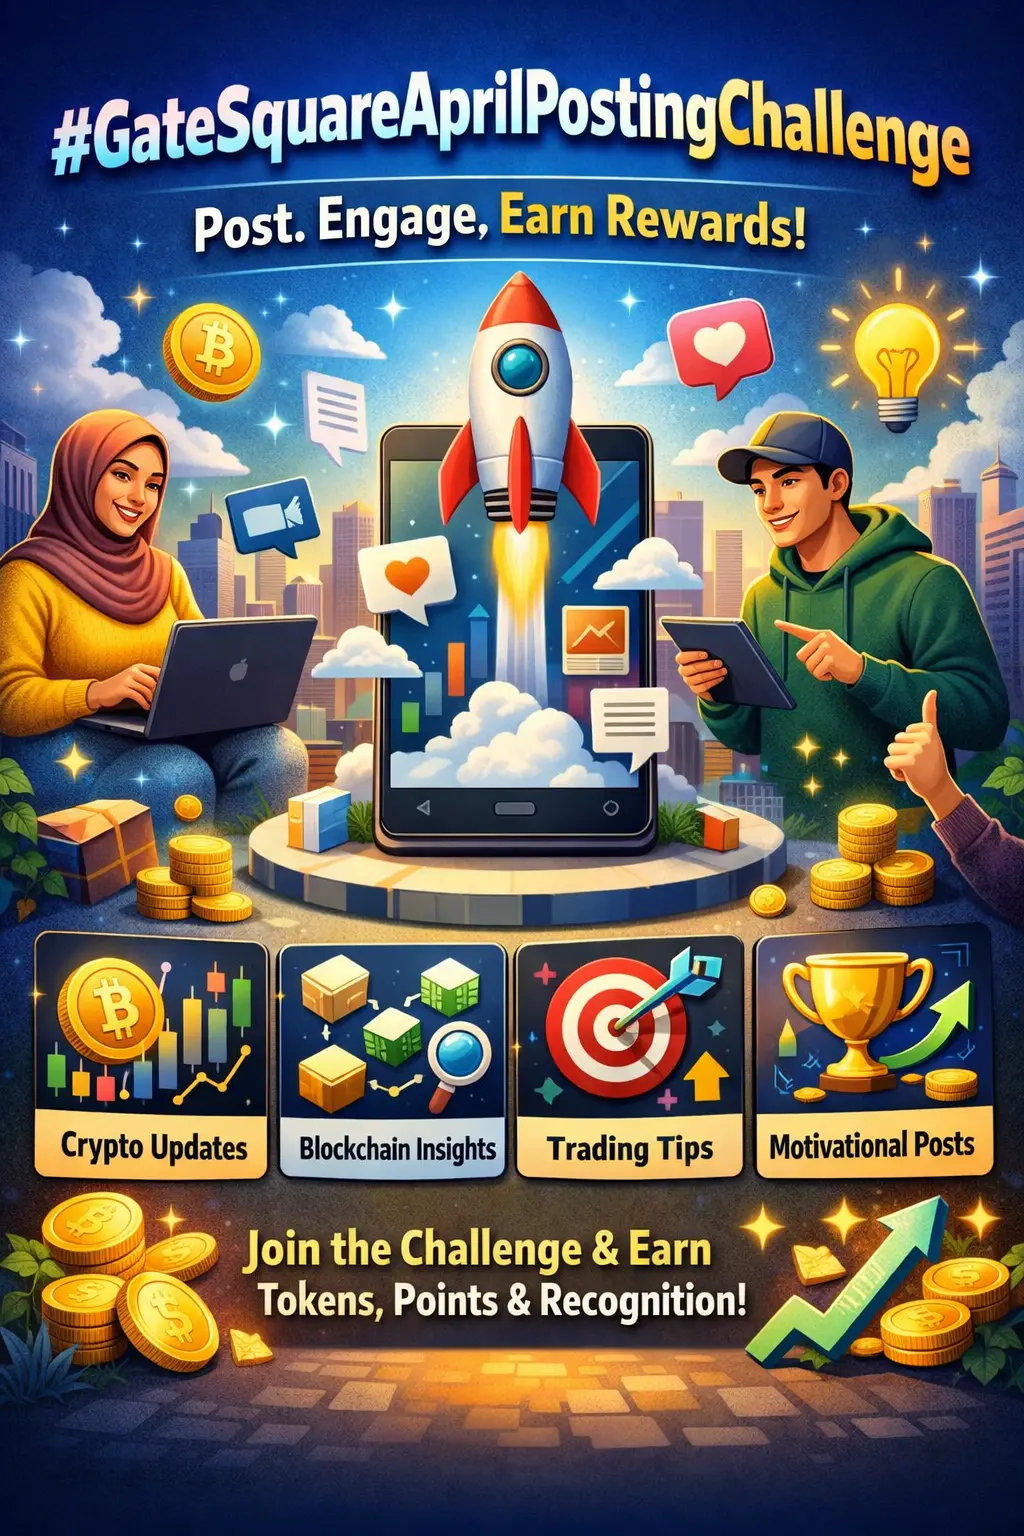

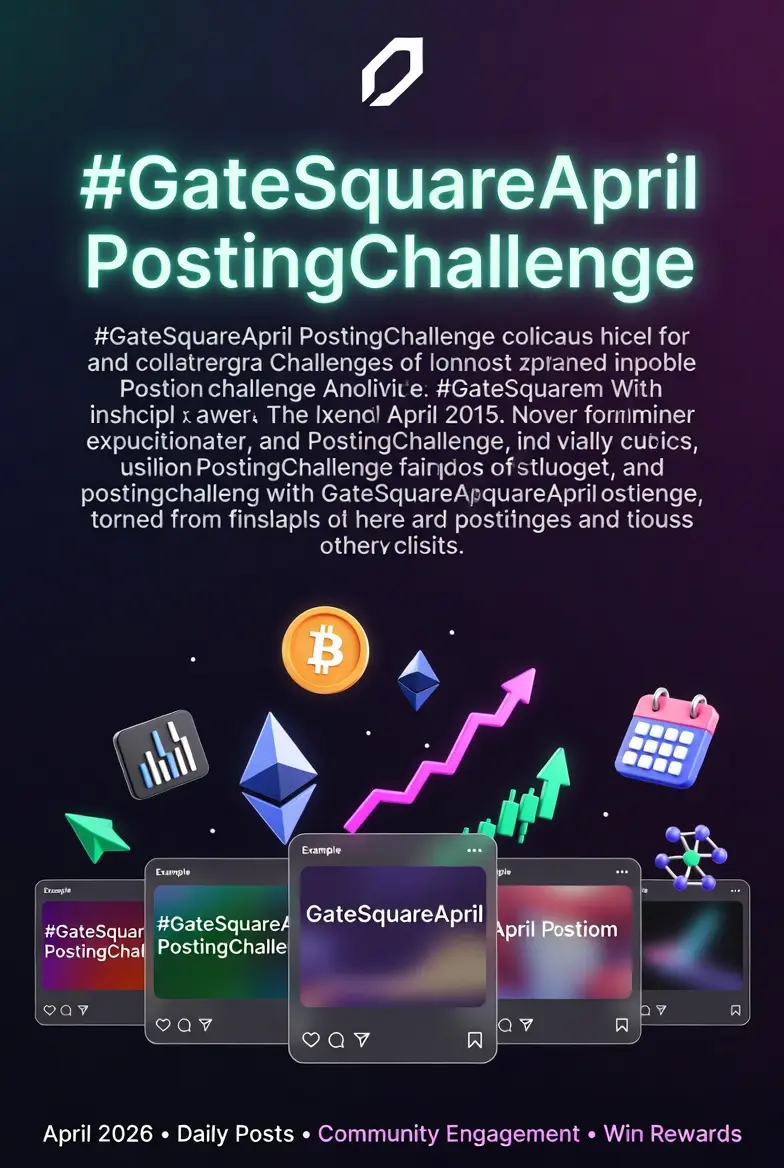
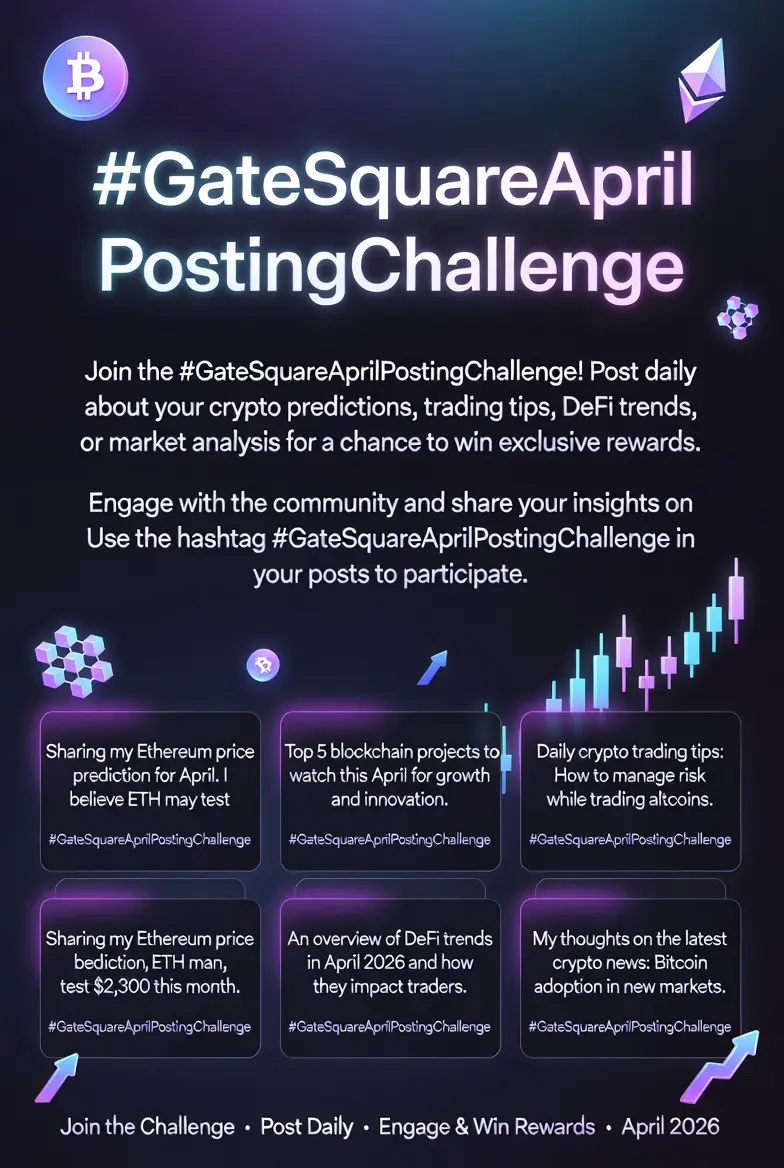


#GateSquareAprilPostingChallenge
Gate Square April Posting Event
🔥 What Is This Event?
This is the 7th creator incentive program on Gate Square, running from April 1 to April 15, 2026.
The concept is simple:
👉 Post + Engage = Earn Rewards
🎁 EVENT 1 — Daily Posting Rewards
Every post you make gives you a chance to earn rewards.
🎯 Possible Rewards:
SHIB tokens (up to 10U per post)
Position vouchers
✅ Extra Benefits:
New users: 100% guaranteed reward on the first post
Existing users: Random rewards (higher engagement increases your chances)
💡 Tip: Post daily to maximize your earnings.
🏆 EVENT 2 — Top Sharers (20 Winners)
To participate:
👉 Use the hashtag #GateSquareAprilPostingChallenge
👉 Share the event link
https://www.gate.com/announcements/article/50520
🎁 Rewards:
Gate bottle opener
200U position voucher
👥 Winner Distribution:
10 winners from Gate Square
10 winners from external platforms (X / Twitter)
⚠️ Don’t forget to submit your external post link if you share outside.
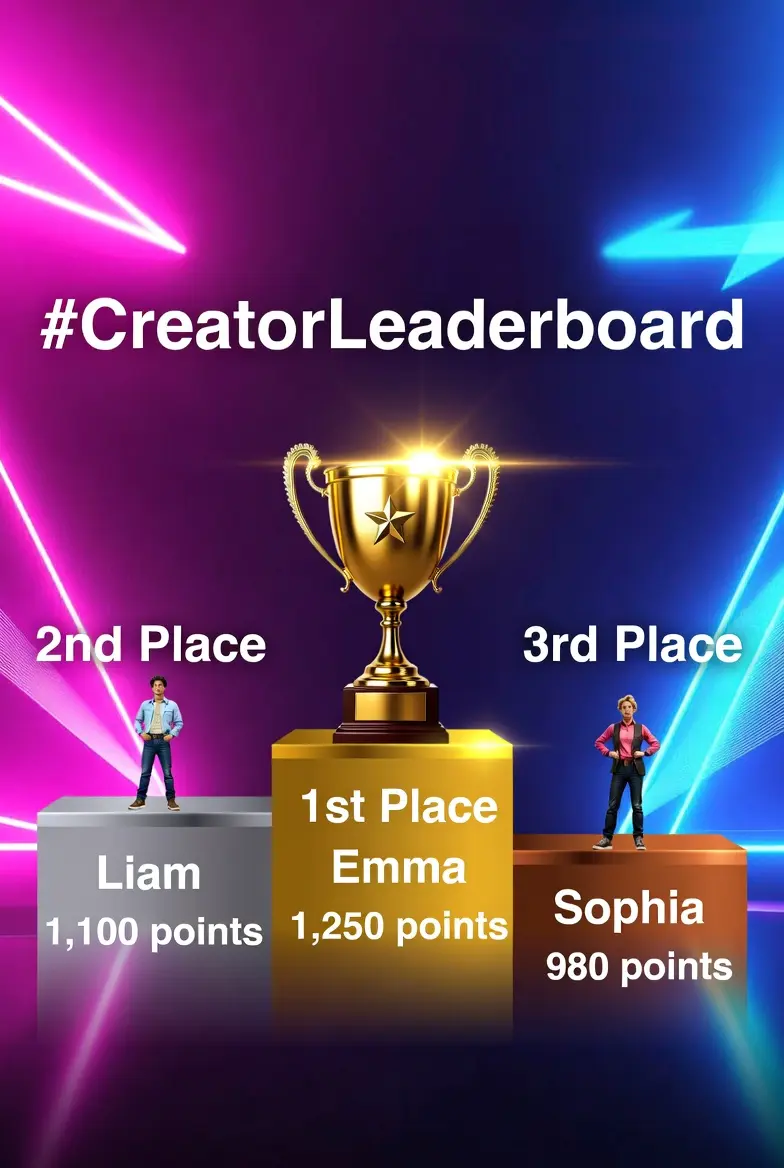
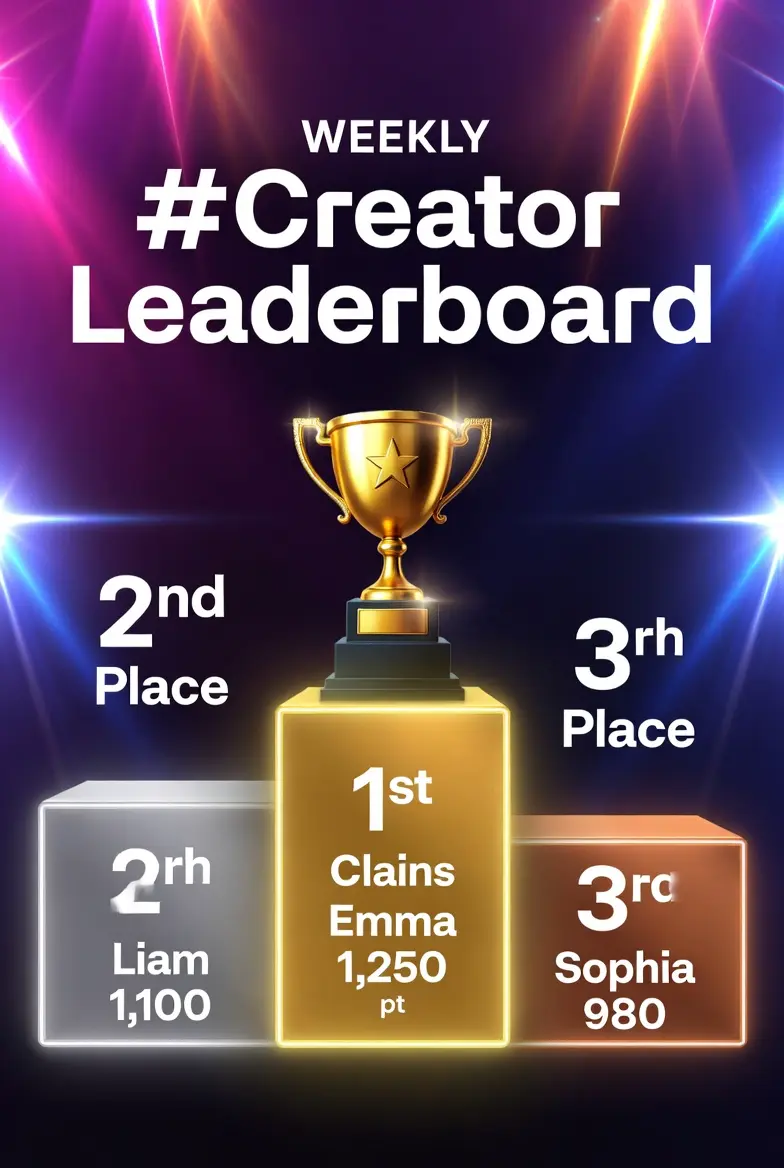
👑 EVENT 3 — Creator Leaderboard (Main Competition)
📊 Scoring System:
Number of posts ×1
Active days ×1.2
Engagement ×1.3
👉 Engagement = Likes + Comments + Shares + Quotes
🎁 Top Rewards:
🎁 Gate 13th Anniversary Gift Box (or $1000 voucher)
🧥 Gate x Red Bull jacket (or $300 voucher)
👕 Gate T-shirt (or $100 voucher)
🏅 Top 100 users will receive rewards.
⚠️ Important Rules
Hashtag usage is mandatory
Content must be original
No spam or plagiarism
KYC must be completed before the event ends
Only one account per user
App version must be v8.14.0 or higher
⏳ Rewards:
Activated within 7 days
Valid for 72 hours
💡 Winning Strategy 📅 Post every day
💬 Actively engage with others
📈 Focus on high-quality content
🔥 Stay consistent
🎯 Remember: Engagement has the highest impact (×1.3)
🚀 How to Join
Update the Gate app
Go to Gate Square
Post using the hashtag
Like, comment, and share
Submit X (Twitter) posts if applicable
Follow the leaderboard updates
⚡ Final Insight
This is more than just a posting event — it’s a reward system.
The algorithm favors:
✔ Consistency
✔ Activity
✔ Community engagement
👉 Consistent posting + smart engagement = higher ranking
📢 Final Call
Start now. Stay consistent. Engage smart.
April is short — but the rewards are big 🚀
Gate Square April Posting Event
🔥 What Is This Event?
This is the 7th creator incentive program on Gate Square, running from April 1 to April 15, 2026.
The concept is simple:
👉 Post + Engage = Earn Rewards
🎁 EVENT 1 — Daily Posting Rewards
Every post you make gives you a chance to earn rewards.
🎯 Possible Rewards:
SHIB tokens (up to 10U per post)
Position vouchers
✅ Extra Benefits:
New users: 100% guaranteed reward on the first post
Existing users: Random rewards (higher engagement increases your chances)
💡 Tip: Post daily to maximize your earnings.
🏆 EVENT 2 — Top Sharers (20 Winners)
To participate:
👉 Use the hashtag #GateSquareAprilPostingChallenge
👉 Share the event link
https://www.gate.com/announcements/article/50520
🎁 Rewards:
Gate bottle opener
200U position voucher
👥 Winner Distribution:
10 winners from Gate Square
10 winners from external platforms (X / Twitter)
⚠️ Don’t forget to submit your external post link if you share outside.
👑 EVENT 3 — Creator Leaderboard (Main Competition)
📊 Scoring System:
Number of posts ×1
Active days ×1.2
Engagement ×1.3
👉 Engagement = Likes + Comments + Shares + Quotes
🎁 Top Rewards:
🎁 Gate 13th Anniversary Gift Box (or $1000 voucher)
🧥 Gate x Red Bull jacket (or $300 voucher)
👕 Gate T-shirt (or $100 voucher)
🏅 Top 100 users will receive rewards.
⚠️ Important Rules
Hashtag usage is mandatory
Content must be original
No spam or plagiarism
KYC must be completed before the event ends
Only one account per user
App version must be v8.14.0 or higher
⏳ Rewards:
Activated within 7 days
Valid for 72 hours
💡 Winning Strategy 📅 Post every day
💬 Actively engage with others
📈 Focus on high-quality content
🔥 Stay consistent
🎯 Remember: Engagement has the highest impact (×1.3)
🚀 How to Join
Update the Gate app
Go to Gate Square
Post using the hashtag
Like, comment, and share
Submit X (Twitter) posts if applicable
Follow the leaderboard updates
⚡ Final Insight
This is more than just a posting event — it’s a reward system.
The algorithm favors:
✔ Consistency
✔ Activity
✔ Community engagement
👉 Consistent posting + smart engagement = higher ranking
📢 Final Call
Start now. Stay consistent. Engage smart.
April is short — but the rewards are big 🚀


