CollectionOfExcellentBlogger
vip
Age 0.5 Yıl
Peak Tier 2
No content yet
ETH warns of a failed breakout with over 100 points drop, avoid going long above 3060
ETH1.24%
View Original
  • Reward
  • 1
  • Repost
  • Share
muhengivip:
Bull Run 🐂
Seeing him on the street, can you tell if he's wealthy? Which do you think is the most attractive about him?
View Original
post-image
  • Reward
  • Comment
  • Repost
  • Share
Follow Feiyang and make a profit
View Original
post-image
post-image
  • Reward
  • Comment
  • Repost
  • Share
1. BTC is currently consolidating within a horizontal rectangular range on the weekly chart. The descending trendline (around 92,500–93,000) is a key resistance level, while the lower Bollinger Band at 88,000 serves as important support. On the daily chart, BTC is in a triangular consolidation range. If it breaks above the triangle's upper boundary (upper Bollinger Band), the target is in the 96,000–100,000 range (covering the FVG gap and Fibonacci 0.5–0.618 levels); if it breaks below the triangle's lower boundary (middle Bollinger Band), the price is likely to continue oscillating within the
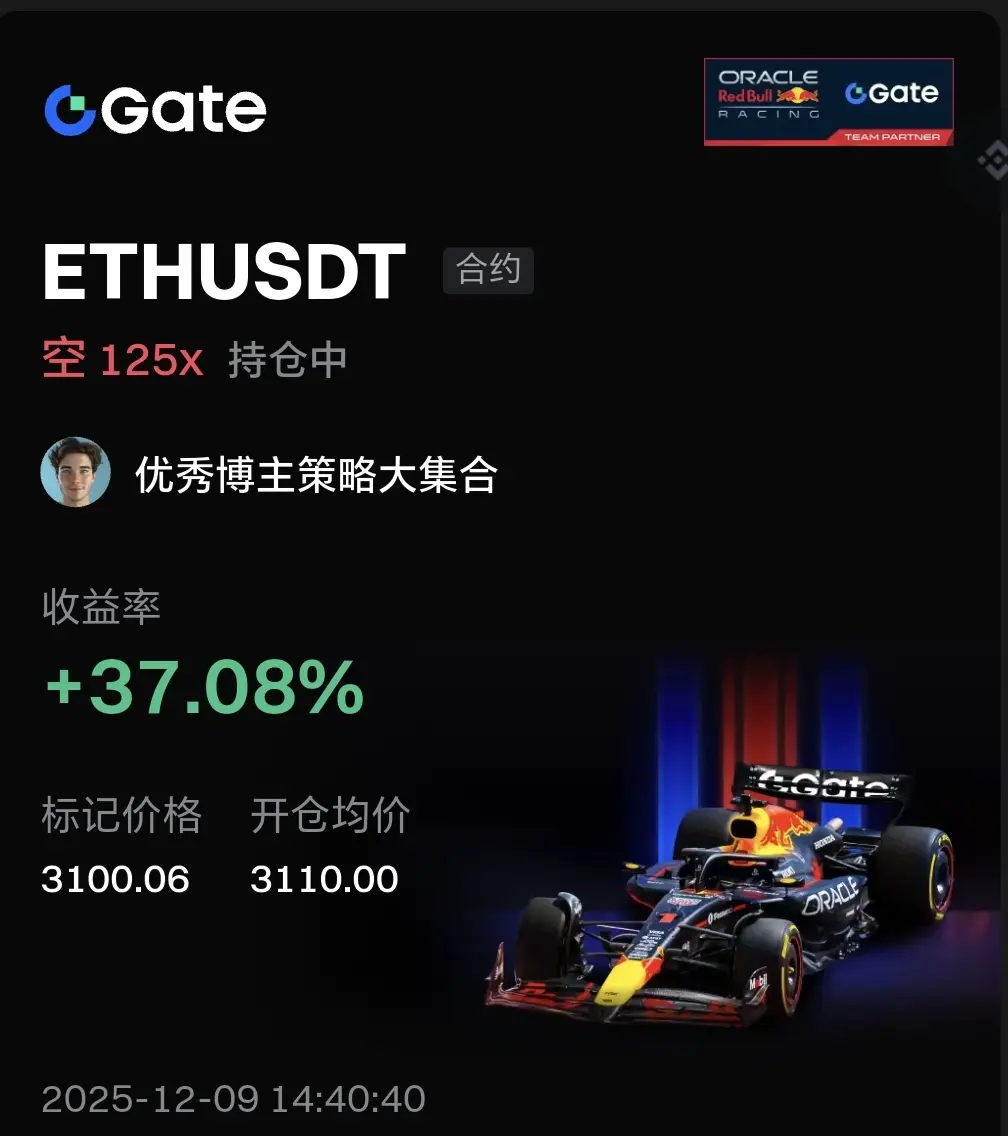
BTC2.27%
SUI7.48%
View Original
[The user has shared his/her trading data. Go to the App to view more.]
  • Reward
  • Comment
  • Repost
  • Share
AI Analysis: $ETC/USDT
Entry Price: 13.22–13.32
Target Price:
- TP1: 13.45
- TP2: 13.58
- TP3: 13.70
Stop Loss: Below 13.05
Reason for Buying:
1. Pattern Confirmation:
- A "double bottom" reversal structure has formed on the daily chart (neckline at 13.45), with a bottom depth of 0.4 (13.05–13.45)
- Measured increase = bottom depth × 1.618 = 0.647 → Target Price 3 = 13.05 + 0.647 = 13.697 (rounded to 13.70)
2. Trend Structure:
- Weekly chart has broken above the 2024 downtrend line (connecting 13.70→13.58), price is above MA(50) 13.28
- RSI(14) = 62 (strong region), expanding M
ETC1.16%
View Original
[The user has shared his/her trading data. Go to the App to view more.]
  • Reward
  • Comment
  • Repost
  • Share
AI Analysis: $ETH/USDT
Entry Price: 3105–3125
Target Price:
- TP1: 3155
- TP2: 3180
- TP3: 3215
Stop Loss: below 3075
Reasons to Buy:
1. Pattern Confirmation:
- Double bottom reversal structure formed on the daily chart (neckline at 3155), measured move targets 3215
2. Trend Structure:
- Weekly chart breaks above descending trendline, price stands above MA(50) 3115
- RSI(14)=68, expanding MACD bullish histogram shows buyers are dominant
3. Market Sentiment:
- "Panic selling - stepped absorption" bottoming signal appears around the 3100 area
- Closed above 3105 for 5 consecutive days (histo
ETH1.24%
View Original
[The user has shared his/her trading data. Go to the App to view more.]
  • Reward
  • Comment
  • Repost
  • Share
AI Analysis: $ADA/USDT
Entry Price: 0.4250–0.4290
Target Price:
- TP1: 0.4345
- TP2: 0.4410
- TP3: 0.4475
Stop Loss: Below 0.4185
Buy Reasons:
1. Pattern Confirmation:
- Daily chart shows a “double bottom” reversal structure (neckline at 0.4345), bottom depth 0.016 (0.4185-0.4345)
- Measured increase = bottom depth × 1.618 = 0.026 → Target Price 3 = 0.4185+0.026=0.4445 (rounded to 0.4475)
2. Trend Structure:
- Weekly chart broke above the 2024 downtrend line (0.4475→0.4410), price above MA(50) 0.427
- RSI(14)=62 (strong zone), MACD red bars expanding indicating bullish momentum
3. Market S
ADA2.26%
View Original
[The user has shared his/her trading data. Go to the App to view more.]
  • Reward
  • Comment
  • Repost
  • Share
AI Analysis: $LTC/USDT
Entry Price: 82.90–83.40
Target Price:
- TP1: 84.20
- TP2: 85.10
Stop Loss: Below 82.20
Reasons to Buy:
1. Pattern Confirmation:
- Double bottom reversal structure formed on daily chart (neckline at 84.20), bottom depth 2.0 (82.20-84.20)
- Measured move = bottom depth × 1.618 = 3.24 → Target 2 = 82.20 + 3.24 = 85.44 (rounded to 85.10)
2. Trend Structure:
- Weekly chart breaks 2024 downtrend line (from 85.10 to 84.20), price above MA(50) 83.1
- RSI(14) = 62 (strong zone), MACD red bars expanding, indicating stronger bullish momentum
3. Market Sentiment:
- "Panic selli
LTC3.57%
View Original
[The user has shared his/her trading data. Go to the App to view more.]
  • Reward
  • Comment
  • Repost
  • Share
[December 8 — December 12 Macro Highlights]
Core: Fed rate decision, December dot plot, will Powell be pushed toward dovish rate cut rhetoric?
1. Confirmed Data
- December 11 (03:00 Beijing time): Fed announces interest rate; CME rate cut probability at 86%, essentially locked in
2. Will further rate cuts continue?
① December dot plot:
- How much rate cut room is left after the neutral rate enters 3.50%—3.75% range;
- 2026 path—number and magnitude of cuts, implying the latest assessment of the economy, employment, and inflation
② Powell press conference:
- Hawkish cut: raising the threshold f
View Original
[The user has shared his/her trading data. Go to the App to view more.]
  • Reward
  • Comment
  • Repost
  • Share
AI Analysis: $HMSTR/USDT
Entry Price: 0.000222–0.000228
Target Price:
- TP1: 0.000210
- TP2: 0.000195
Stop Loss: Above 0.000242
Reasons for Selling:
1. Pattern Confirmation:
- A "double top" reversal structure has formed on the daily chart (neckline at 0.000210), with a top depth of 0.000032 (0.000242-0.000210)
- Measured decline = top depth × 1.618 = 0.000052 → Target price 2 = 0.000242-0.000052=0.000190 (rounded to 0.000195)
2. Trend Structure:
- Weekly chart has broken below the 2024 uptrend line (connecting 0.000195→0.000210), price is below MA(50) 0.000225
- RSI(14
HMSTR3.37%
View Original
[The user has shared his/her trading data. Go to the App to view more.]
  • Reward
  • Comment
  • Repost
  • Share
AI Analysis: $DENT/USDT
Entry Price: 0.000255–0.000262
Target Price:
- TP1: 0.000280
- TP2: 0.000305
Stop Loss Price: Below 0.000240
Reasons to Buy:
1. Pattern Confirmation:
- Double bottom reversal structure formed on the daily chart (neckline at 0.000280), bottom depth of 0.00004 (0.000240–0.000280)
- Measured move = bottom depth × 1.618 = 0.000064 → Target Price 2 = 0.000240 + 0.000064 = 0.000304 (rounded to 0.000305)
2. Trend Structure:
- Weekly chart breaks 2024 downtrend line (0.000305→0.000280), price stands above MA(50) 0.000258
- RSI(14) = 62 (strong zone), MACD red ba
DENT4.43%
View Original
[The user has shared his/her trading data. Go to the App to view more.]
  • Reward
  • Comment
  • Repost
  • Share
AI Analysis: $KAVA/USDT
Entry Price: 0.1050–0.1070
Target Price:
- TP1: 0.1020
- TP2: 0.0990
Stop Loss: Above 0.1105
Reasons for Selling:
1. Pattern Confirmation:
- Daily chart shows a "double top" reversal structure (neckline at 0.1020), top depth 0.0085 (0.1105-0.1020)
- Measured drop = top depth × 1.618 = 0.0138 → Target Price 2 = 0.1105-0.0138=0.0967 (rounded to 0.0990)
2. Trend Structure:
- Weekly chart breaks below the 2024 uptrend line (0.0990→0.1020 connection), price falls below MA(50) 0.106
- RSI(14)=32 (weak region), MACD dead cross with expanding red bars, clear bearish signals
3.
KAVA-4.3%
View Original
[The user has shared his/her trading data. Go to the App to view more.]
  • Reward
  • Comment
  • Repost
  • Share
AI Analysis: $FUN/USDT
Entry Price: 0.00210–0.00212
Target Price:
- TP1: 0.00205
- TP2: 0.00200
Stop Loss: above 0.00218
Reason for Selling:
1. Pattern Confirmation:
- Double top reversal structure formed on daily chart (neckline at 0.00205), top depth 0.00013 (0.00218-0.00205)
- Measured drop = top depth × 1.618 = 0.00021 → Target Price 2 = 0.00218-0.00021=0.00197 (rounded to 0.00200)
2. Trend Structure:
- Weekly chart breaks the 2024 uptrend line (connecting 0.00200→0.00205), price falls below MA(50) at 0.00212
- RSI(14) = 32 (weak area), MACD death cross with expanding red bars, clear beari
FUN0.39%
View Original
[The user has shared his/her trading data. Go to the App to view more.]
  • Reward
  • Comment
  • Repost
  • Share
AI Analysis: $ZEC/USDT
Entry Price: 343–346
Target Price:
- TP1: 335
- TP2: 328
- TP3: 320
Stop Loss: Above 353
Reasons for Selling:
1. Pattern Confirmation:
- A "double top" reversal pattern has formed on the daily chart (neckline at 335), with a top depth of 18 (335-353)
- Measured drop = top depth × 1.618 = 29 → Target price 3 = 353-29=324 (rounded down to 320)
2. Trend Structure:
- On the weekly chart, price has broken below the 2024 uptrend line (connecting 320→328), and fallen below MA(50) 345
- RSI(14)=32 (weak area), MACD bearish crossover with expanding red bars, clear
ZEC3.73%
View Original
[The user has shared his/her trading data. Go to the App to view more.]
  • Reward
  • Comment
  • Repost
  • Share
AI Analysis: $JASMY/USDT
Entry Price: 0.00691
Target Price:
- TP1: 0.00750
- TP2: 0.00780
- TP3: 0.00850 (strong resistance zone)
Stop Loss: Below 0.00654
Reasons to Buy:
1. Pattern Confirmation:
- 3-hour chart forms a "double bottom" reversal structure (neckline at 0.00750), bottom depth 0.00096 (0.00654-0.00750)
- Measured move = bottom depth × 1.618 = 0.00155 → Target price 3 = 0.00654 + 0.00155 = 0.00809 (rounded to 0.00850)
2. Trend Structure:
- Daily chart breaks short-term downtrend line (0.00850→0.00780), price stands above MA(50) 0.00715
- RSI(14) = 68 (overbought but strong), MACD re
JASMY1.03%
View Original
[The user has shared his/her trading data. Go to the App to view more.]
  • Reward
  • Comment
  • Repost
  • Share
AI Analysis: $DASH/USDT
Entry Price: 47.50
Target Prices:
- TP1: 55
- TP2: 70
- TP3: 85
- Long-term Target: 104+
Stop Loss: Below 41
Reasons to Buy:
1. Pattern Confirmation:
- Weekly chart has formed a "rectangle consolidation" breakout structure (neckline at 52), consolidation range height 11 (41-52)
- Measured move = range height × 1.618 = 17.8 → Target Price 2 = 52 + 17.8 = 69.8 (rounded up to 70)
2. Trend Structure:
- Monthly chart has broken through the 2024 downtrend line (connecting 104→85), price stands above MA(50) 50
- RSI(14) = 58 (neutral to bullish), expanding MACD histogram shows
DASH-2.04%
View Original
[The user has shared his/her trading data. Go to the App to view more.]
  • Reward
  • Comment
  • Repost
  • Share
  • Trending TopicsView More
  • Pin
Trade Crypto Anywhere Anytime
qrCode
Scan to download Gate App
Community
  • 简体中文
  • English
  • Tiếng Việt
  • 繁體中文
  • Español
  • Русский
  • Français (Afrique)
  • Português (Portugal)
  • Bahasa Indonesia
  • 日本語
  • بالعربية
  • Українська
  • Português (Brasil)