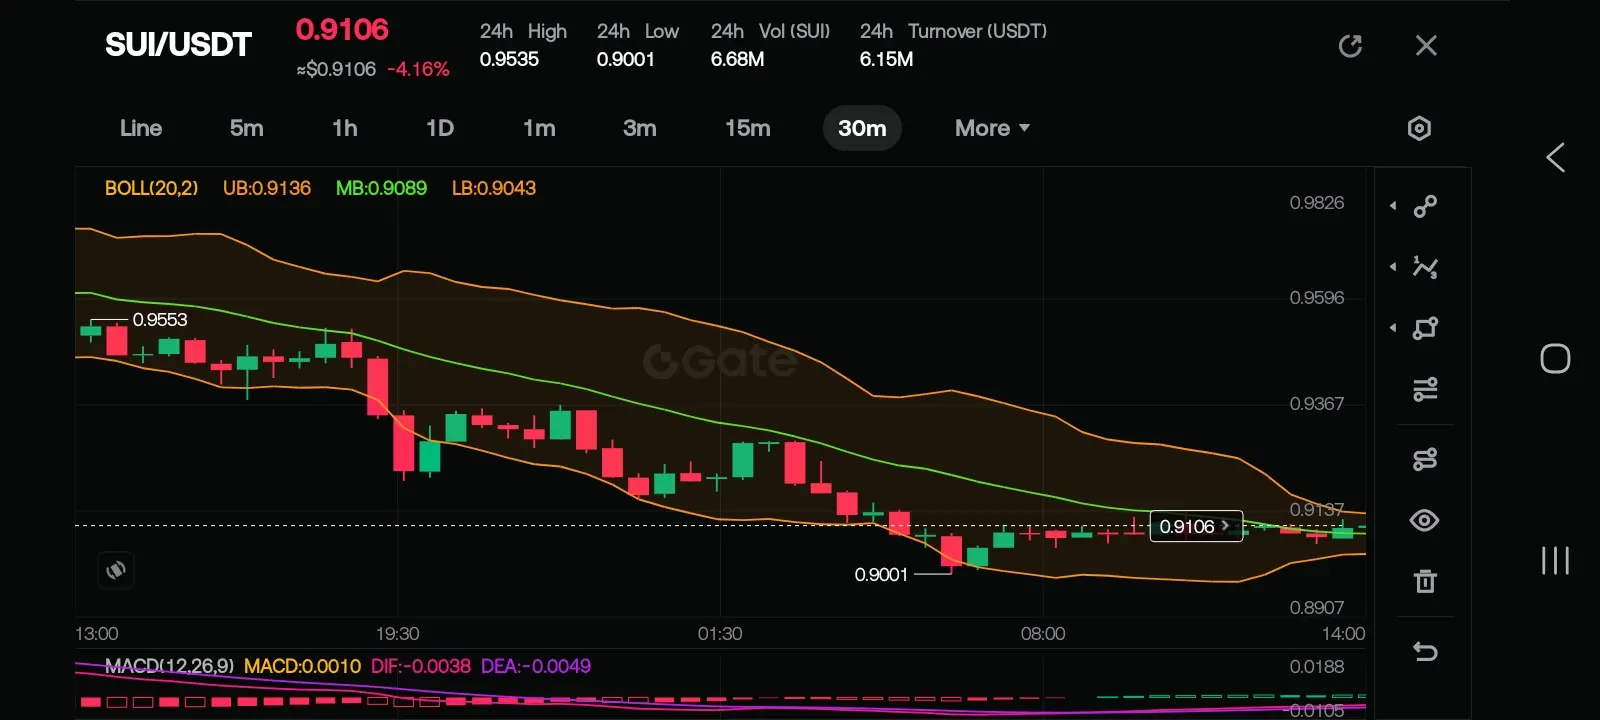
SUI/USDT, here’s a quick technical analysis:
$SUI
Price & Trend
· Current price: 0.9106 USDT (-4.16%).
· Trading below the 24h high (0.9535) and near the 24h low (0.9001), showing bearish short-term pressure.
Bollinger Bands (20,2)
· Price is near the middle band (MB: 0.9089) and slightly above the lower band (LB: 0.9043).
· This suggests low volatility and consolidation, but with a downward bias.
MACD (12,26,9)
· MACD line: 0.0010 (barely positive)
· DIF: -0.0038, DEA: -0.0049 → The DIF is still below the DEA but narrowing.
· This could hint at a potential bullish crossover if momentum pic