
Key Takeaways
-
Virtuals Protocol (VIRTUAL) is holding around 20% monthly gains despite short-term market weakness.
-
The 4H chart shows a developing inverse head and shoulders pattern, a classic bullish reversal structure.
-
Price recently faced rejection near the $0.85 neckline, suggesting the right shoulder is still forming.
-
A potential dip toward the $0.78 support zone could complete the pattern and attract buyers.
-
A confirmed breakout above $0.85 may open the door for a stronger upside move, while losing $0.78 could delay the bullish setup.
Virtuals Protocol (VIRTUAL), the native token of the decentralized infrastructure and launchpad powering autonomous AI agents, has been holding up relatively well despite recent market-wide hesitation. The token is still sitting on around 20% monthly gains, although it is trading slightly in the red today in line with broader crypto sentiment.
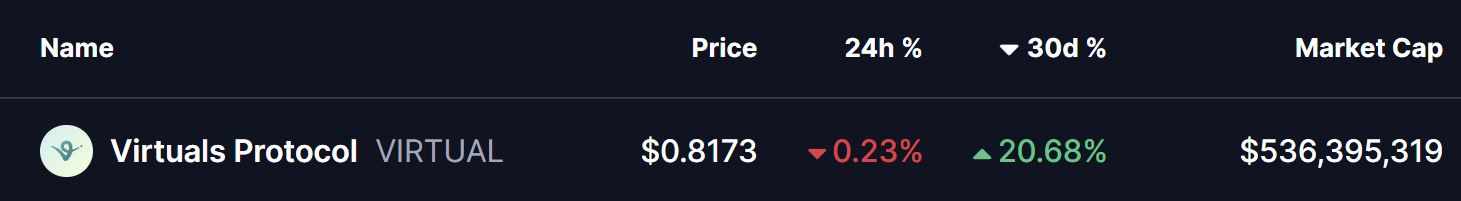
Source: Coinmarketcap
However, when you zoom into the chart, the price action tells a more interesting story. Beneath the short-term weakness, VIRTUAL appears to be building a classic bullish reversal structure, one that could act as the base for a stronger upside move if confirmed.
Inverse Head and Shoulders Pattern Takes Shape
On the 4-hour timeframe, VIRTUAL has carved out a clear inverse head and shoulders pattern, a formation often associated with trend reversals after a prolonged pullback.
-
The left shoulder developed near the $0.80 zone, where buyers initially stepped in.
-
This was followed by a deeper decline toward $0.75, forming the head of the structure and marking the local low.
-
Price then rebounded toward the descending neckline resistance around $0.85, where it faced rejection once again.
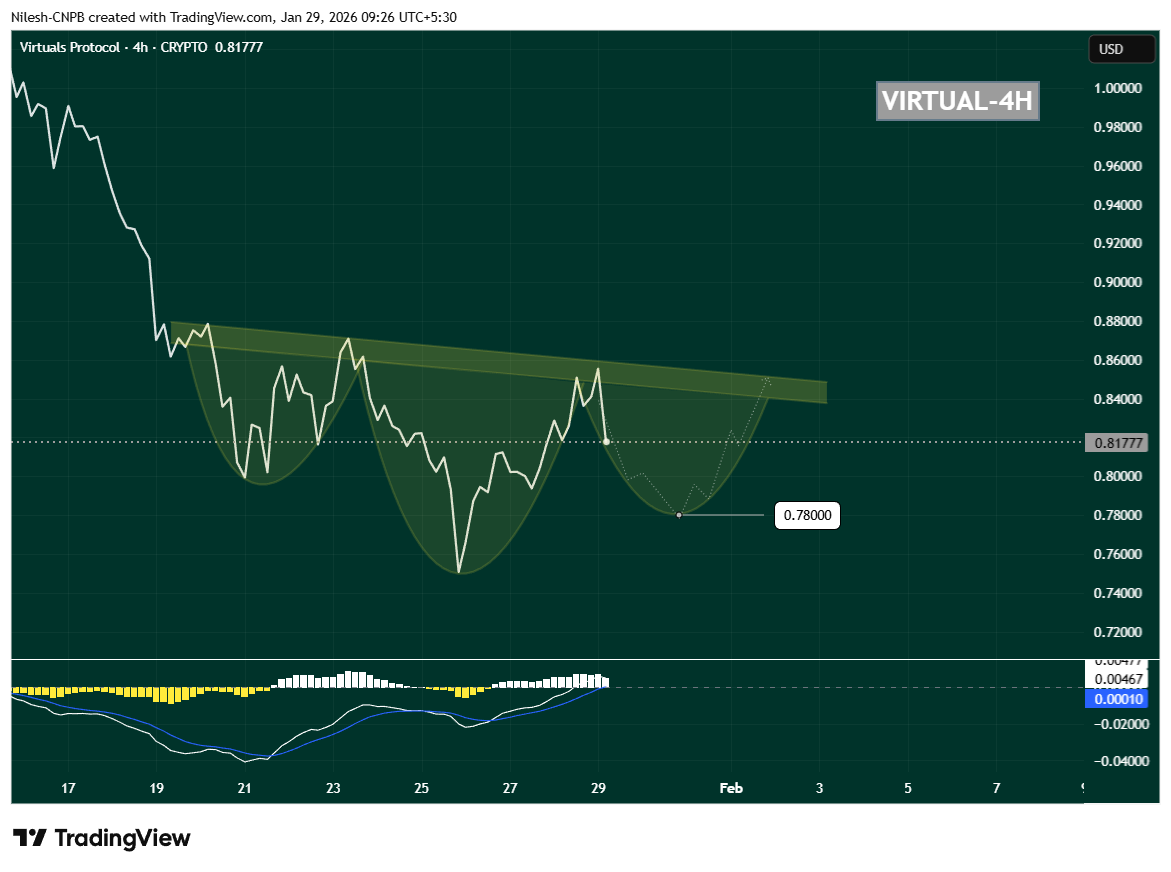
VIRTUAL 4H Chart/Coinsprobe (Source: Tradingview)
Following this rejection, VIRTUAL has started to drift lower and is currently trading near $0.8177, suggesting that the right shoulder may still be forming. This behavior fits well with the textbook structure of the pattern and keeps the bullish setup technically valid for now.
Momentum Signals Support the Setup
Momentum indicators are also worth watching closely. On the same timeframe, the MACD is cooling off and curling downward, reflecting short-term weakness rather than a full trend breakdown. In many cases, this kind of MACD reset during right-shoulder formation actually helps fuel the next impulsive move higher once buyers regain control.
As long as selling pressure remains controlled and price avoids a sharp breakdown, this momentum reset can work in favor of the bulls.
What’s Next for VIRTUAL?
If the pattern continues to play out, VIRTUAL could dip toward the $0.78 region, which aligns well with the projected right-shoulder bottom visible on the chart. This zone may act as a critical demand area where buyers look to step back in.
A strong bounce from this region, followed by renewed buying pressure, would increase the probability of a bullish breakout attempt toward the $0.85 neckline. A clean move above this resistance would confirm the inverse head and shoulders pattern and signal a potential shift back into a short-term uptrend.
On the downside, losing the $0.78 support decisively would weaken the structure and delay the bullish thesis, potentially opening the door for deeper consolidation.
For now, VIRTUAL is at a key technical crossroads. The structure remains constructive, the pattern is intact, and the chart suggests that the next major move—up or down—could arrive once this right shoulder finishes forming. Traders will be watching closely how price reacts around support in the coming sessions.
Disclaimer: The views and analysis presented in this article are for informational purposes only and reflect the author’s perspective, not financial advice. Technical patterns and indicators discussed are subject to market volatility and may or may not yield the anticipated results. Investors are advised to exercise caution, conduct independent research, and make decisions aligned with their individual risk tolerance.
About Author: Nilesh Hembade is the Founder and Lead Author of Coinsprobe, with over 5 years of experience in the cryptocurrency and blockchain industry. Since launching Coinsprobe in 2023, he has been providing daily, research-driven insights through in-depth market analysis, on-chain data, and technical research.
Disclaimer: The information on this page may come from third parties and does not represent the views or opinions of Gate. The content displayed on this page is for reference only and does not constitute any financial, investment, or legal advice. Gate does not guarantee the accuracy or completeness of the information and shall not be liable for any losses arising from the use of this information. Virtual asset investments carry high risks and are subject to significant price volatility. You may lose all of your invested principal. Please fully understand the relevant risks and make prudent decisions based on your own financial situation and risk tolerance. For details, please refer to
Disclaimer.
Related Articles
Bitcoin Sits at a Crucial Support Level, Analyst Expects Break Above $79,000 or Below $64,000
Bitcoin sits at a crucial support level, big move could play out soon.
Analyst expects break above $79,000 for bullish reaction.
A bearish reaction and a drop below $64,000 could also play out.
This week was an exciting one for the
CryptoNewsLand44m ago
Solana Recovery Gains Pace While Derivatives Data Shows Split Sentiment
Key Insights
Solana records four consecutive days of gains as funding rates rise, signaling stronger retail interest while overall market conviction remains divided across participants.
Declining futures Open interest alongside rising funding rates highlights reduced trader exposure,
CryptoNewsLand1h ago
ATOM Eyes 15% Gain: Technical Indicators Point to Possible Upswing
ATOM broke a long bearish trend with a 5.25% price increase.
Price must close above $1.77 to confirm a potential 15% rally.
Top holders and rising Open Interest indicate growing bullish sentiment among traders.
Cosmos — ATOM, has started showing signs of breaking free from a long bearish
CryptoNewsLand2h ago
Bitcoin’s implied volatility drops to an intra-year low, and the market is reacting mildly to Friday’s CPI data
April 9, U.S. March CPI data will be released on April 11. The market expects the year-over-year rate to rise from 2.4% to 3.4%. The Bitcoin market has responded calmly, with the options market’s volatility range only at 2.5%. Attention has been drawn by the rise in gasoline prices. Analysts believe that CPI data coming in either too soft or too hot will have different impacts on the crypto market.
GateNews3h ago
XRP Stabilizes Near Key Levels Amid Fed Pressure and Rule Shift
Key Insights
XRP stabilized near $1.31 as macroeconomic pressures and declining liquidity combined to limit recovery momentum and increase short-term volatility risks significantly.
Proposed stablecoin regulations favor utility models, positioning RLUSD for growth while reducing incentives t
CryptoNewsLand3h ago
XRP Today’s News: Institutional funds return, circulating inflow of 120 million exceeds Bitcoin
This week, XRP recorded a $119.6 million capital inflow, setting the highest mark since 2025 and becoming a major beneficiary in the crypto market. This round of funds returning was mainly driven by greater clarity in regulatory policy and XRP’s real-world use in cross-border payment infrastructure. Technically, it shows an initial recovery, but overall it is still in a downward channel. The support and resistance levels are $1.31 and $1.40, respectively; if it breaks through, it is expected to reach $1.50.
MarketWhisper5h ago
