
Key Takeaways
-
Aster (ASTER) has hit a new all-time low near $0.54 amid a broader crypto market sell-off.
-
The current price structure closely mirrors Hyperliquid (HYPE)’s 2025 bottoming fractal, which preceded a 200%+ rally.
-
ASTER is forming a potential rounding bottom after a ~77% drawdown from its peak.
-
A reclaim of the 50-day moving average near $0.79 could signal early trend reversal.
-
The activation of ASTER’s Strategic Buyback Reserve may help stabilize price and reduce circulating supply.
As of January 19, 2026, Aster (ASTER) is under heavy pressure, printing a fresh all-time low at $0.5420. The sharp drop comes amid a broader market sell-off triggered by escalating US–EU trade tensions, which wiped out nearly $875 million in leveraged long positions across crypto. Bitcoin (BTC) and Ethereum (ETH) are both down 2–3% on the day, and smaller-cap tokens like ASTER have taken the brunt of the impact.
ASTER has now fallen more than 12% in the past 24 hours, but beneath the surface, the price structure is beginning to tell a more nuanced story. Interestingly, the current setup closely resembles the bottoming fractal previously seen in Hyperliquid (HYPE) — a structure that ultimately preceded a powerful upside reversal.
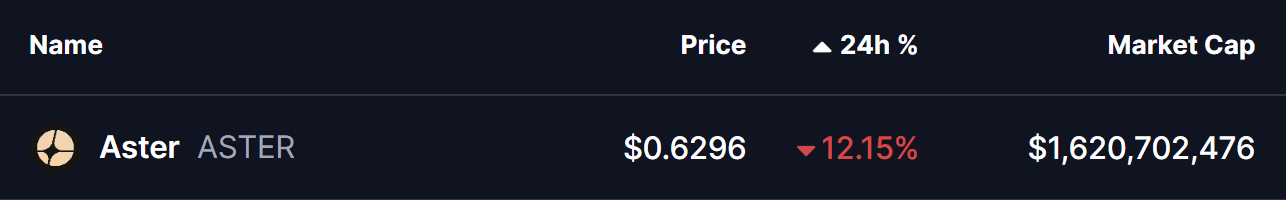
Source: Coinmarketcap
ASTER Mirrors HYPE’s Bottoming Path
A closer look at the comparative chart reveals striking similarities between ASTER’s current price action and HYPE’s April 2025 bottoming phase.
HYPE’s move started with a sharp correction following its all-time high. Price slipped below the 50-day moving average, signaling a momentum shift. Instead of continuing lower aggressively, HYPE entered a rounding bottom structure, reflecting gradual seller exhaustion. The final low came after a deep 73% drawdown from the peak, marking a clear inflection point in market sentiment.
What followed was critical. HYPE reclaimed both the 50-day and 100-day moving averages, confirming a trend shift. That technical reclaim ignited a breakout from the rounding base, leading to a 207% rally — one of HYPE’s most notable reversals of 2025.
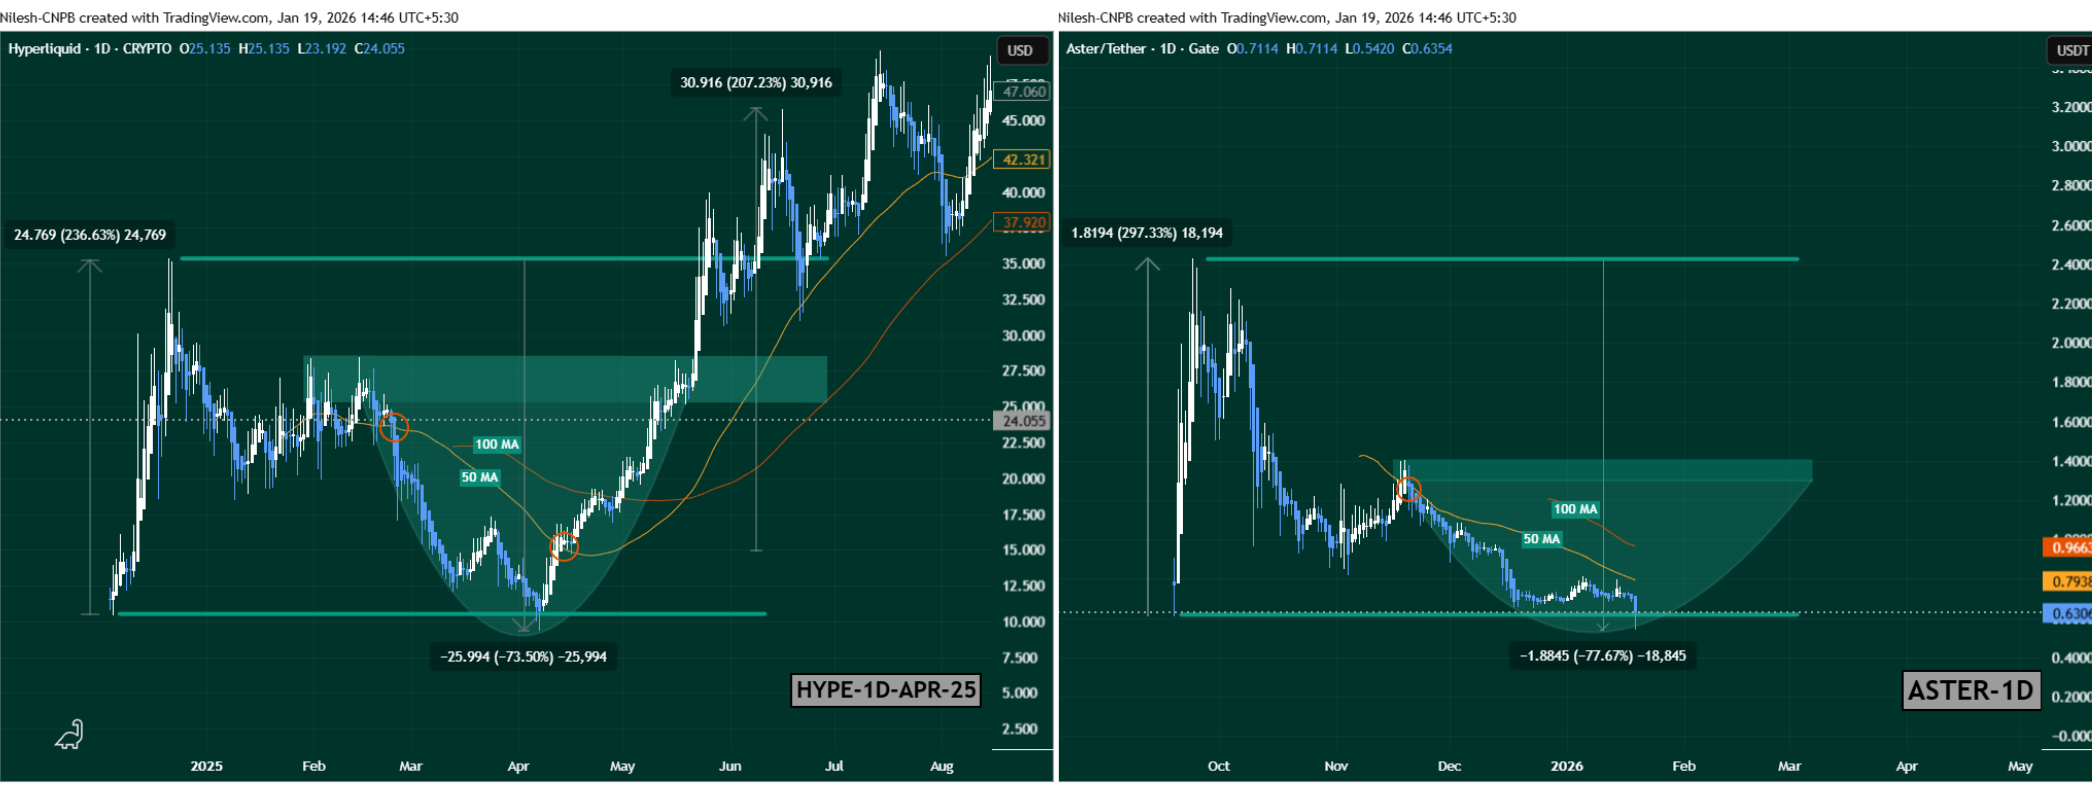
HYPE and ASTER Fractal Chart/Coinsprobe (Source: Tradingview)
ASTER now appears to be walking a similar road.
After topping near its all-time high around $2.42, ASTER entered a prolonged corrective phase and lost its 50-day moving average. Price has since been carving out what looks like a rounding bottom, with today’s low near $0.54, representing a steep 77% drawdown from the top. The structure, momentum loss, and gradual flattening strongly resemble HYPE’s pre-reversal behavior highlighted in the fractal comparison.
What’s Next for ASTER?
If this fractal continues to unfold, ASTER may be approaching a critical inflection point.
From a bullish perspective, the first key confirmation would be a reclaim of the 50-day moving average, currently sitting near $0.7983. A sustained move above this level would signal weakening bearish momentum and growing buyer confidence.
Beyond that, the major level to watch lies at the neckline resistance near $1.4066. A clean breakout above this zone could shift ASTER into a broader recovery phase, potentially mirroring the type of upside expansion HYPE experienced once its reversal was confirmed.
Adding to the constructive backdrop, Aster activated its Strategic Buyback Reserve today. The protocol is now automatically repurchasing $ASTER using 20–40% of daily platform fees, expanding its Stage 5 buyback program launched in December 2025. These buybacks are on-chain verifiable, dynamically adjusted based on market conditions, and designed to gradually reduce circulating supply. Notably, early buyback activity is already visible on-chain, and the timing coincides with ASTER printing fresh lows — a move widely viewed as a stabilization effort.
Key Risk Note
While fractal similarities can provide valuable context, they are not guarantees. Market conditions, liquidity profiles, and sentiment can vary significantly between assets and cycles. ASTER still needs confirmation through moving average reclaims and follow-through buying. A failure to hold current support zones would weaken the bottoming thesis and open the door to further downside.
Bottom Line
ASTER appears to be approaching a make-or-break zone. The emerging rounding bottom, historical fractal similarity to HYPE, and the launch of an active buyback mechanism all point toward a potential shift in momentum. Whether this structure evolves into a confirmed bottom or turns into another pause before continuation lower will depend on how price reacts around the 50-day moving average and key resistance levels in the days ahead.
Disclaimer: The views and analysis presented in this article are for informational purposes only and reflect the author’s perspective, not financial advice. Technical patterns and indicators discussed are subject to market volatility and may or may not yield the anticipated results. Investors are advised to exercise caution, conduct independent research, and make decisions aligned with their individual risk tolerance.
About Author: Nilesh Hembade is the Founder and Lead Author of Coinsprobe, with over 5 years of experience in the cryptocurrency and blockchain industry. Since launching Coinsprobe in 2023, he has been providing daily, research-driven insights through in-depth market analysis, on-chain data, and technical research.
Disclaimer: The information on this page may come from third parties and does not represent the views or opinions of Gate. The content displayed on this page is for reference only and does not constitute any financial, investment, or legal advice. Gate does not guarantee the accuracy or completeness of the information and shall not be liable for any losses arising from the use of this information. Virtual asset investments carry high risks and are subject to significant price volatility. You may lose all of your invested principal. Please fully understand the relevant risks and make prudent decisions based on your own financial situation and risk tolerance. For details, please refer to
Disclaimer.
Related Articles
Bitcoin Breaks Through $78,000, Ethereum Hits $2,390: Market Panic Eases
Bitcoin breaks through $78,000, while Ethereum climbs above $2,390. This article reviews the V-shaped reversal trend from April 13 to 22, analyzing the evolution of liquidation data and the Fear and Greed Index.
GateInstantTrends28m ago
SHIB Struggles to Recover as Fresh Developments Fail to Lift Price Action
SHIB trading activity rises, but price stays trapped in a tight consolidation range.
Whale accumulation increases while some long-term holders, including Aoki, exit positions.
Strong derivatives volume and inflows fail
CryptoNewsLand2h ago
Macro Recovery Drives Risk Asset Inflows; Crypto Market Shows Divergence Between Mainstream and Altcoins
Global risk appetite rose on easing Middle East tensions, lower energy prices, and strong institutional support, pushing equities to new highs; gold held gains while crypto and ETFs posted modest moves.
Global risk sentiment improved as tensions eased and energy prices fell, with equities at highs, gold firm, and crypto modestly higher; regulatory steps included France backing euro stablecoins and Circle's USDC Bridge.
GateNews3h ago
XRP’s Explosive Rise Isn’t Over Yet: Breaking Down Its Massive Returns
XRP delivered massive historical returns, contradicting claims of no appreciation.
Analyst highlights “Bifrost Bridge” channel as key to long-term bullish structure.
Current consolidation and ecosystem growth signal potential for another major breakout.
Critics often claim that Ripple’s
CryptoNewsLand3h ago
Trump Extends Iran Ceasefire Indefinitely as Brent Hovers Near $100
Summary: Trump extends Iran ceasefire indefinitely to allow peace talks; oil prices steady near highs as Strait of Hormuz blockade persists; gold rises, stocks mixed amid negotiation uncertainty.
Abstract: President Trump announced an indefinite extension of the Iran ceasefire to facilitate negotiations, while Tehran reportedly did not request the extension and warned the Strait of Hormuz would stay closed. Oil prices remained near highs despite the blockade; gold rose; regional markets posted mixed results.
GateNews3h ago
Crypto Fear and Greed Index Falls to 33, Signaling Panic Conditions
Crypto Fear and Greed Index fell to 33, down from yesterday, signaling panic. The 7-day average is 27 and the 30-day average 16, indicating sustained bearish sentiment over the past month.
The Crypto Fear and Greed Index fell to 33, signaling panic in the market. The 7-day average is 27 and the 30-day average is 16, indicating bearish sentiment has persisted for a month.
GateNews4h ago
