
Key Takeaways
-
Hyperliquid (HYPE) has dropped over 19% on the week, with price stabilizing near a critical demand zone.
-
The $19.22–$19.55 support area is emerging as a key level where sellers may lose control.
-
A bearish Shark harmonic pattern is forming on the daily chart, hinting at a potential rebound if support holds.
-
Strong token burns and notable whale buying are acting as a contrarian signal amid broader weakness.
-
A reclaim of the 50-day moving average near $26.39 could confirm a bullish recovery phase.
Hyperliquid’s native token, HYPE, remains under sustained selling pressure as bearish momentum continues to dominate short-term price action. As of January 21, HYPE is trading nearly 9% lower on the day, extending its weekly decline to over 19%. The token is currently hovering around the $20.65 region, an area that is quickly becoming a decisive technical battleground.
While the chart reflects heavy downside pressure, a mix of aggressive supply reduction, strategic buying, and an emerging harmonic structure is raising the question: Is a rebound quietly setting up beneath the surface?
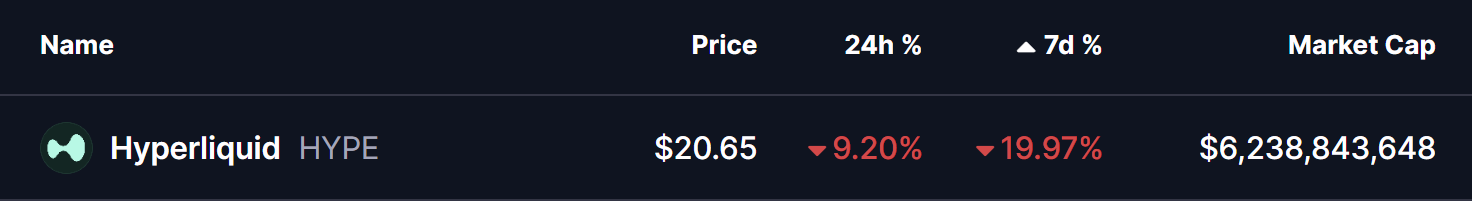
Source: Coinmarketcap
Burn and Buying Add a Contrarian Signal
Despite the ongoing price weakness, on-chain activity tells a more nuanced story.
As of January 21, Hyperliquid’s assistance fund burned 39 million HYPE tokens, permanently removing roughly 3.9% of the maximum supply from circulation. At the same time, notable buyers stepped in during the sell-off.
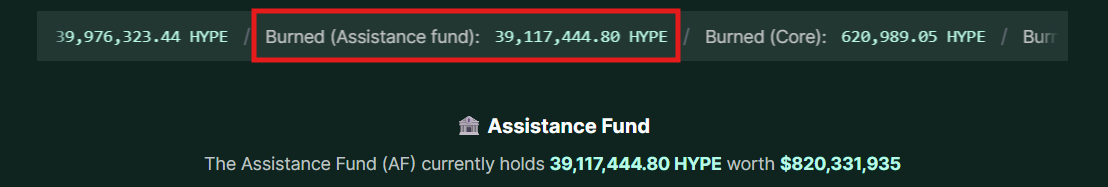
Source: hypeburn
-
Arthur Hayes reportedly purchased** 19,000 HYPE**
-
The assistance fund itself continues to buy aggressively, paying prices over 50% higher than current market levels
This combination of sustained burning and dip-buying suggests growing long-term conviction, even as short-term sentiment remains fragile.
Could This Emerging Pattern Trigger a Rebound?
From a technical perspective, the daily chart shows HYPE entering the early stages of a bearish Shark harmonic pattern.
After completing the O-X-A leg, price rolled over and is now pressing toward the projected B-point support zone between $19.22 and $19.55. This area is highlighted on the chart as a historically reactive demand zone and could mark a potential exhaustion point for sellers.
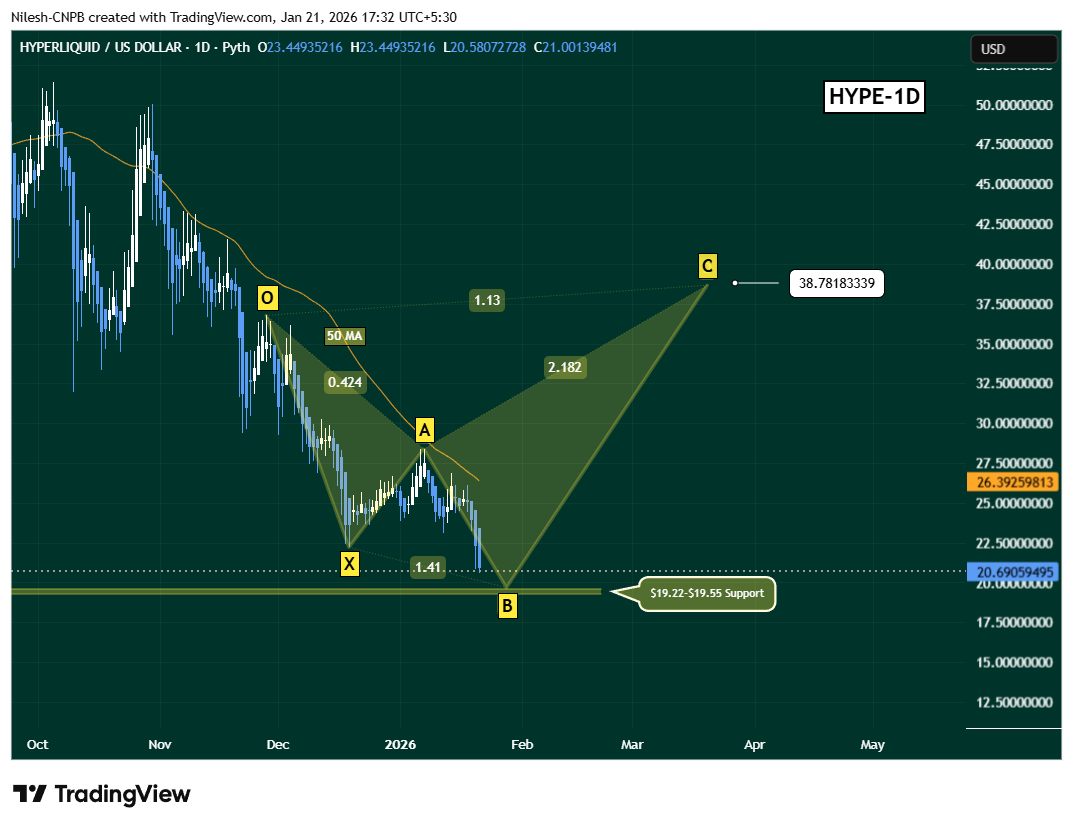
Hyperliquid (HYPE) Daily Chart/Coinsprobe (Source: Tradingview)
If buyers step in around this support and price begins to stabilize, the next key technical hurdle would be a reclaim of the 50-day moving average near $26.39. A decisive move back above this level would strengthen the rebound thesis and open the door for a recovery move toward the C-point near $38.7, where the Shark pattern’s projected extension sits around the 1.13 level.
What’s Next for HYPE?
For now, the pattern remains in development, not confirmed. The coming sessions will be critical.
-
Holding the $19.22–$19.55 zone would keep the harmonic setup alive
-
Rising volume and stronger daily closes could signal buyer commitment
-
A break back above the 50-day MA would act as early confirmation of a trend shift
On the downside, a failure to hold the lower support zone would invalidate the pattern and leave HYPE vulnerable to deeper consolidation.
For now, Hyperliquid sits at a technical inflection point, where intense selling pressure collides with supply destruction and early structural support. Whether this develops into a meaningful rebound or another leg lower will depend on how price reacts at the lower boundary in the days ahead.
Disclaimer: The views and analysis presented in this article are for informational purposes only and reflect the author’s perspective, not financial advice. Technical patterns and indicators discussed are subject to market volatility and may or may not yield the anticipated results. Investors are advised to exercise caution, conduct independent research, and make decisions aligned with their individual risk tolerance.
About Author: Nilesh Hembade is the Founder and Lead Author of Coinsprobe, with over 5 years of experience in the cryptocurrency and blockchain industry. Since launching Coinsprobe in 2023, he has been providing daily, research-driven insights through in-depth market analysis, on-chain data, and technical research.
Disclaimer: The information on this page may come from third parties and does not represent the views or opinions of Gate. The content displayed on this page is for reference only and does not constitute any financial, investment, or legal advice. Gate does not guarantee the accuracy or completeness of the information and shall not be liable for any losses arising from the use of this information. Virtual asset investments carry high risks and are subject to significant price volatility. You may lose all of your invested principal. Please fully understand the relevant risks and make prudent decisions based on your own financial situation and risk tolerance. For details, please refer to
Disclaimer.
Related Articles
XRP Rises 4% as Ripple Partnership and ETF Inflows Drive Recovery
XRP rose 4% to $1.41, boosted by Ripple's partnership with Kyobo Life and increasing institutional interest. Broader market gains and positive community engagement also contributed, though XRP remains 63% below its peak. Key support is at $1.38.
GateNews6h ago
ETH/BTC ratio rebounds—are institutional funds rotating? A deep dive into structural signals in the crypto market
BTC breaks through $75,000; the Iran–Israel ceasefire and fresh highs in U.S. stocks lift risk assets, but the options market remains somewhat cautious. The ETH/BTC ratio rebounds, signaling capital rotation.
GateInstantTrends7h ago
Crypto Market Rebounds 1.5% to $2.54T as Bitcoin Leads Rally Amid Tech Surge and Policy Progress
The crypto market rebounded 1.5% to $2.54 trillion, led by Bitcoin's 7% gain amid easing geopolitical tensions and strong ETF inflows. Analysts predict further gains if Bitcoin surpasses $76K resistance.
GateNews8h ago
Bitcoin bull market index rises to 40 points; Bloomberg: the U.S. and Iran are considering extending the ceasefire agreement by two weeks
Bitcoin’s price as of April 16 is approaching $74,700. The Bullish Sentiment Index (BSI) has risen to 40 points, indicating a rebound in market sentiment. The United States and Iran are evaluating options to extend the current ceasefire agreement, and they are also discussing navigation issues in the Strait of Hormuz, as diplomatic negotiations continue.
MarketWhisper13h ago
Bitcoin holds steady at 74K, and FOMO sentiment is heating up as U.S. stocks hit a record high
Benefiting from positive news about the U.S.-Iran peace agreement, the stock market surged sharply, with the Nasdaq index and the S&P 500 index reaching record highs. Bitcoin remained steady at 74K, market sentiment improved, and the Fear & Greed Index rose to 55. Investor FOMO toward the stock market intensified, and the total market capitalization in the crypto market increased overall, indicating genuine buy-side interest.
ChainNewsAbmedia14h ago
