
Key Takeaways
-
AAVE is trading near $173 after a healthy pullback, while still maintaining a strong weekly uptrend.
-
The 4-hour chart shows a clear ascending channel, signaling sustained bullish structure.
-
The 50-period moving average around $171 is acting as key short-term support.
-
A breakdown below support could lead to a dip toward $166, still within bullish structure.
-
A confirmed breakout above $180–$186 may open the door for a move toward $200+.
As of January 18, 2026, Aave (AAVE) is trading around $173.34, posting a mild 0.97% dip over the last 24 hours. Despite the short-term pullback, the broader picture remains constructive, with AAVE still up 4.22% over the past week. This steady recovery signals renewed buyer interest after a prolonged consolidation phase, keeping Aave firmly in focus among top DeFi tokens.
With a market capitalization near $2.65 billion, Aave continues to stand out as one of the most resilient decentralized lending protocols. More importantly, the chart structure is now hinting that a larger move could be brewing beneath the surface.
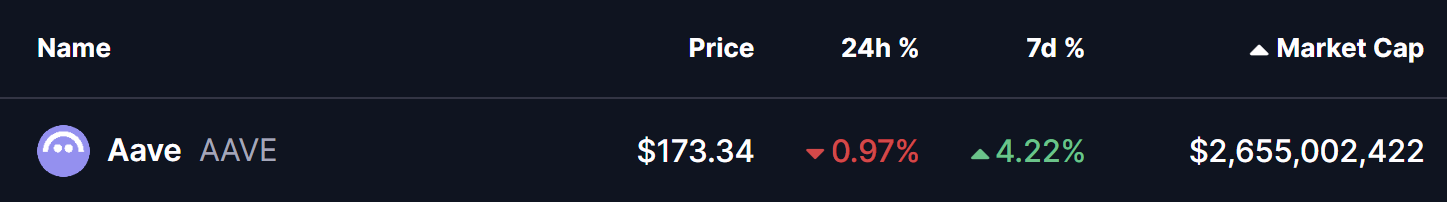
Source: Coinmarketcap
Ascending Channel Structure Emerges
On the 4-hour timeframe, AAVE is respecting a well-defined ascending channel, a bullish pattern characterized by a sequence of higher highs and higher lows. Price action has consistently bounced from the lower boundary of the channel, indicating that buyers are stepping in on dips rather than waiting for deeper pullbacks.
Recently, AAVE faced rejection near the upper boundary around $180.43, triggering a short-term retracement. The pullback, however, has been orderly rather than impulsive, with price now hovering just above the 50-period moving average near $171.09, which is acting as immediate dynamic support.
This behavior suggests healthy consolidation rather than trend exhaustion, keeping the bullish channel structure intact for now.
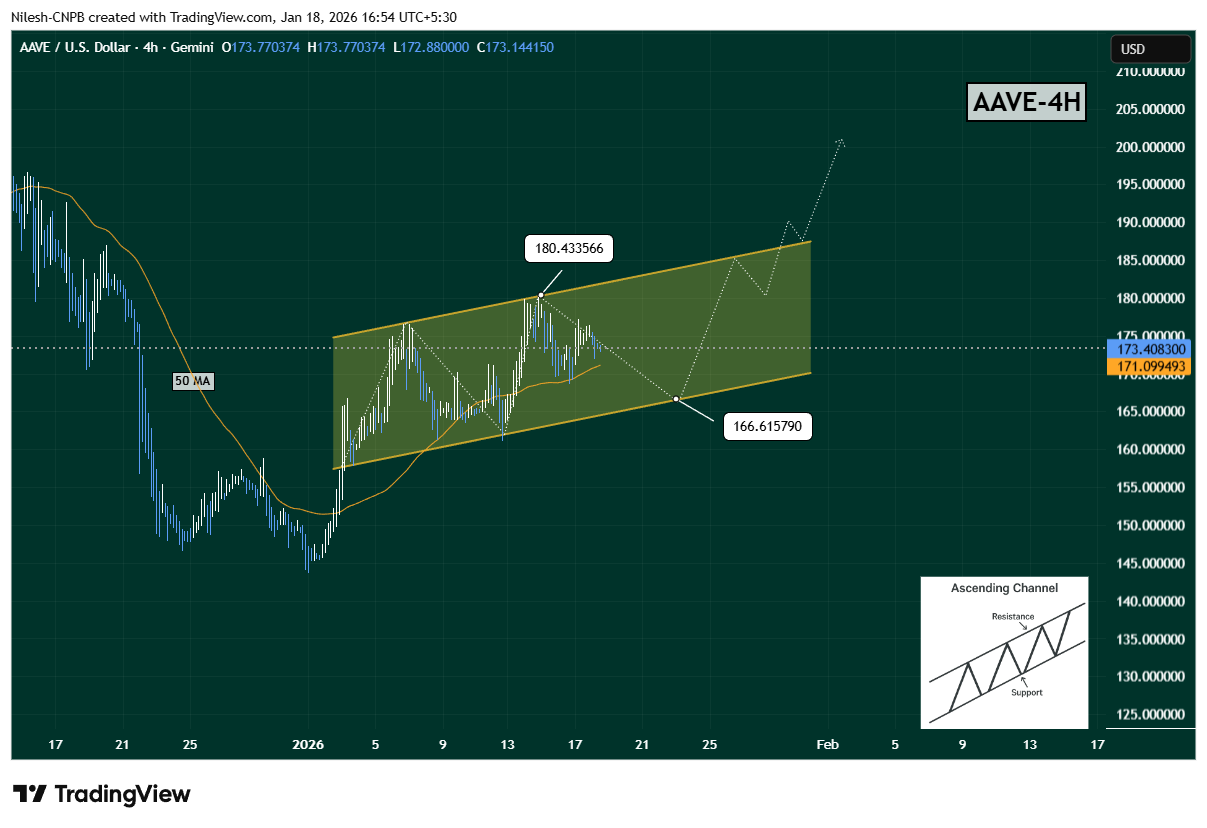
AAVE 4H Chart/Coinsprobe (Source: Tradingview)
What’s Next for AAVE?
If AAVE fails to hold the 50 MA, the next likely downside test sits near the lower boundary of the ascending channel around $166.61, representing a potential 4% downside from current levels. A move into this zone would still be considered a normal corrective pullback within the broader bullish structure.
Then a strong bounce from channel support could send AAVE back toward the upper boundary around $180–$186 resistance zone. A clean breakout above this region would signal strength returning to buyers and could open the door for an accelerated move toward the psychological $200 level and beyond.
That said, patience is key. A confirmed breakout above channel resistance would provide much stronger validation than anticipation alone.
Bottom Line
Aave is quietly building a bullish continuation setup after months of sideways action. The ascending channel on the 4-hour chart highlights steady accumulation, with buyers defending key support levels.
If AAVE rebounds from channel support, a retest of $180–$186 looks likely — and a breakout there could quickly shift momentum toward the $200+ zone. Until then, the current consolidation remains a critical phase that could define AAVE’s next major move.
All eyes are now on how price reacts around support — because the next bounce may determine whether bulls take full control heading into next week.
Disclaimer: The views and analysis presented in this article are for informational purposes only and reflect the author’s perspective, not financial advice. Technical patterns and indicators discussed are subject to market volatility and may or may not yield the anticipated results. Investors are advised to exercise caution, conduct independent research, and make decisions aligned with their individual risk tolerance.
About Author: Nilesh Hembade is the Founder and Lead Author of Coinsprobe, with over 5 years of experience in the cryptocurrency and blockchain industry. Since launching Coinsprobe in 2023, he has been providing daily, research-driven insights through in-depth market analysis, on-chain data, and technical research.
Disclaimer: The information on this page may come from third parties and does not represent the views or opinions of Gate. The content displayed on this page is for reference only and does not constitute any financial, investment, or legal advice. Gate does not guarantee the accuracy or completeness of the information and shall not be liable for any losses arising from the use of this information. Virtual asset investments carry high risks and are subject to significant price volatility. You may lose all of your invested principal. Please fully understand the relevant risks and make prudent decisions based on your own financial situation and risk tolerance. For details, please refer to
Disclaimer.
Related Articles
BTC 15-minute rise 0.48%: stronger spot buy-side demand combined with shrinking liquidity driving the move
2026-04-13 14:30 to 2026-04-13 14:45 (UTC), BTC saw a +0.48% return within a 0.55% amplitude range (71600.7–71997.0 USDT). During this period, market volatility increased; both spot and on-chain data indicate that short-term capital flows were notably active, market attention rose, and sentiment remains cautious.
The main driver behind this deviation is stronger spot-market buy pressure and the continued net outflow of exchange funds. Specifically, over the past 24 hours, BTC spot trading volume was about $33.15B, compared with the 7-day average
GateNews1h ago
Bitmine gets promoted to the NYSE main board! Tom Lee: US stocks may be at their bottom, and selling pressure on Ether could ease
Bitmine has officially transferred from the NYSE American board to the main board in the United States, marking an important milestone for the company. Despite a significant drop in its share price, it has still increased the share repurchase plan amount to $4.0 billion. The company holds a large amount of Ether, and it expects that a rebound in the crypto market will help improve its assets and share price performance.
CryptoCity1h ago
Gold and silver fall across the board, and the BTC/ETH volatility index rises slightly
On April 13, gold and silver prices fell to $4,732.92 per ounce and $74.209 per ounce, respectively. The BTC volatility index rose by 0.42%, and the ETH volatility index rose by 0.31%. The U.S. dollar versus the Chinese yuan and the Japanese yen edged up slightly, major European stock indexes generally fell, while WTI and Brent crude oil prices rose. The Gate platform supports trading for multiple asset types.
GateNews1h ago
ETH 15-minute rise of 1.24%: On-chain capital outflows and macro risk aversion converge to boost volatility
From 2026-04-13 13:45 to 14:00 (UTC), ETH surged rapidly within a 1.48% amplitude. The price ranged from 2182.61 to 2214.98 USDT, and the return rate in 15 minutes reached +1.24%. This bout of unusual activity has drawn market attention, with active capital inflows and outflows, a marked increase in volatility, and a short-term warming of trading sentiment.
The main driver behind this unusual activity is on-chain capital outflows and changes in the holdings structure. Over the past few weeks, the net positions of the 1k–10k ETH whale cohort and the 10k+ super whale cohort have continued to decline, around April 13, the related
GateNews2h ago
Bitcoin retreats to $71k, spot ETF net inflows of nearly $1 billion last week
Bitcoin and Ethereum prices were holding steady around April 13, and the overall crypto market weakened. Oil prices rebounded, influenced by the situation in the Middle East. Bitcoin ETF funds worth nearly $1 billion flowed in, but addresses still in unrealized losses remain in the majority, and open interest in futures contracts fell significantly.
GateNews2h ago
Bitcoin’s Bearish Breakdown Signifies Collapse of Futures-Led Rally
Bitcoin is experiencing significant volatility following a futures-driven market rally that has collapsed, leading to major price corrections and a drop in Open Interest. The market is now vulnerable to further downturns due to a lack of spot demand, indicating structural weaknesses.
BlockChainReporter3h ago
