
Key Takeaways
-
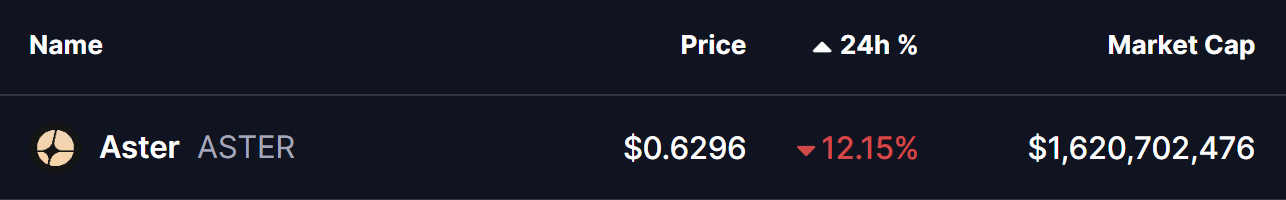
Aster (ASTER) has hit a new all-time low near $0.54 amid a broader crypto market sell-off.
-
The current price structure closely mirrors Hyperliquid (HYPE)’s 2025 bottoming fractal, which preceded a 200%+ rally.
-
ASTER is forming a potential rounding bottom after a ~77% drawdown from its peak.
-
A reclaim of the 50-day moving average near $0.79 could signal early trend reversal.
-
The activation of ASTER’s Strategic Buyback Reserve may help stabilize price and reduce circulating supply.
As of January 19, 2026, Aster (ASTER) is under heavy pressure, printing a fresh all-time low at $0.5420. The sharp drop comes amid a broader market sell-off triggered by escalating US–EU trade tensions, which wiped out nearly $875 million in leveraged long positions across crypto. Bitcoin (BTC) and Ethereum (ETH) are both down 2–3% on the day, and smaller-cap tokens like ASTER have taken the brunt of the impact.
ASTER has now fallen more than 12% in the past 24 hours, but beneath the surface, the price structure is beginning to tell a more nuanced story. Interestingly, the current setup closely resembles the bottoming fractal previously seen in Hyperliquid (HYPE) — a structure that ultimately preceded a powerful upside reversal.
Source: Coinmarketcap
ASTER Mirrors HYPE’s Bottoming Path
A closer look at the comparative chart reveals striking similarities between ASTER’s current price action and HYPE’s April 2025 bottoming phase.
HYPE’s move started with a sharp correction following its all-time high. Price slipped below the 50-day moving average, signaling a momentum shift. Instead of continuing lower aggressively, HYPE entered a rounding bottom structure, reflecting gradual seller exhaustion. The final low came after a deep 73% drawdown from the peak, marking a clear inflection point in market sentiment.
What followed was critical. HYPE reclaimed both the 50-day and 100-day moving averages, confirming a trend shift. That technical reclaim ignited a breakout from the rounding base, leading to a 207% rally — one of HYPE’s most notable reversals of 2025.
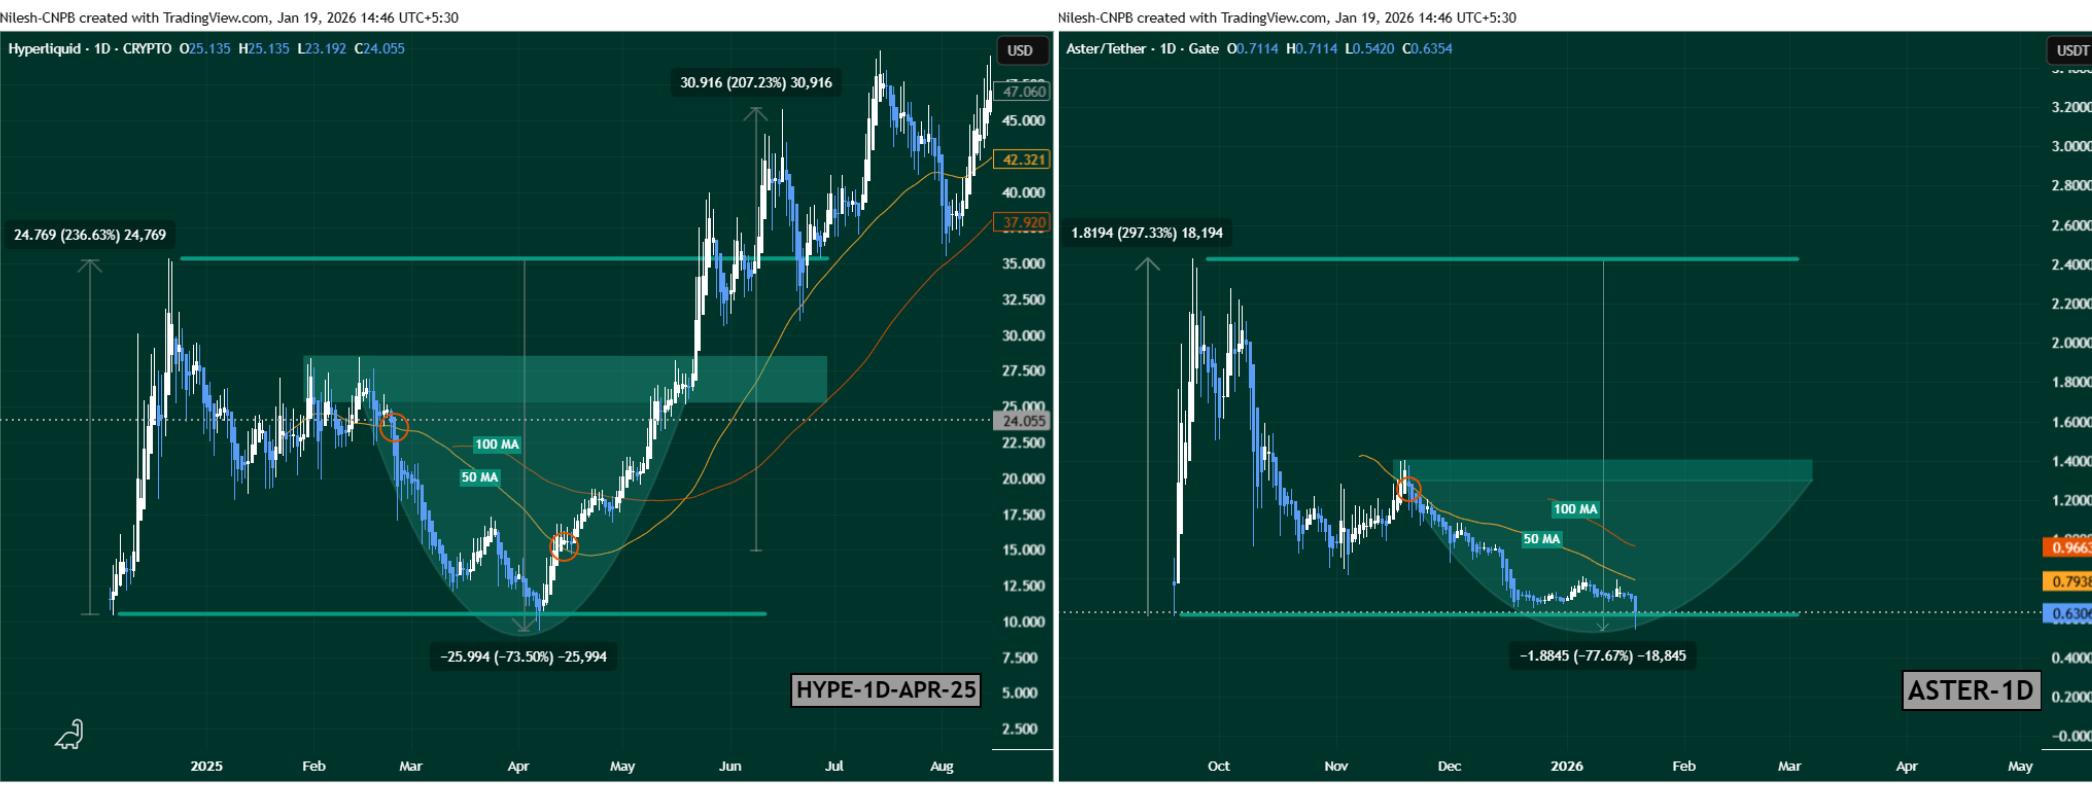
HYPE and ASTER Fractal Chart/Coinsprobe (Source: Tradingview)
ASTER now appears to be walking a similar road.
After topping near its all-time high around $2.42, ASTER entered a prolonged corrective phase and lost its 50-day moving average. Price has since been carving out what looks like a rounding bottom, with today’s low near $0.54, representing a steep 77% drawdown from the top. The structure, momentum loss, and gradual flattening strongly resemble HYPE’s pre-reversal behavior highlighted in the fractal comparison.
What’s Next for ASTER?
If this fractal continues to unfold, ASTER may be approaching a critical inflection point.
From a bullish perspective, the first key confirmation would be a reclaim of the 50-day moving average, currently sitting near $0.7983. A sustained move above this level would signal weakening bearish momentum and growing buyer confidence.
Beyond that, the major level to watch lies at the neckline resistance near $1.4066. A clean breakout above this zone could shift ASTER into a broader recovery phase, potentially mirroring the type of upside expansion HYPE experienced once its reversal was confirmed.
Adding to the constructive backdrop, Aster activated its Strategic Buyback Reserve today. The protocol is now automatically repurchasing $ASTER using 20–40% of daily platform fees, expanding its Stage 5 buyback program launched in December 2025. These buybacks are on-chain verifiable, dynamically adjusted based on market conditions, and designed to gradually reduce circulating supply. Notably, early buyback activity is already visible on-chain, and the timing coincides with ASTER printing fresh lows — a move widely viewed as a stabilization effort.
Key Risk Note
While fractal similarities can provide valuable context, they are not guarantees. Market conditions, liquidity profiles, and sentiment can vary significantly between assets and cycles. ASTER still needs confirmation through moving average reclaims and follow-through buying. A failure to hold current support zones would weaken the bottoming thesis and open the door to further downside.
Bottom Line
ASTER appears to be approaching a make-or-break zone. The emerging rounding bottom, historical fractal similarity to HYPE, and the launch of an active buyback mechanism all point toward a potential shift in momentum. Whether this structure evolves into a confirmed bottom or turns into another pause before continuation lower will depend on how price reacts around the 50-day moving average and key resistance levels in the days ahead.
Disclaimer: The views and analysis presented in this article are for informational purposes only and reflect the author’s perspective, not financial advice. Technical patterns and indicators discussed are subject to market volatility and may or may not yield the anticipated results. Investors are advised to exercise caution, conduct independent research, and make decisions aligned with their individual risk tolerance.
About Author: Nilesh Hembade is the Founder and Lead Author of Coinsprobe, with over 5 years of experience in the cryptocurrency and blockchain industry. Since launching Coinsprobe in 2023, he has been providing daily, research-driven insights through in-depth market analysis, on-chain data, and technical research.
Disclaimer: The information on this page may come from third parties and does not represent the views or opinions of Gate. The content displayed on this page is for reference only and does not constitute any financial, investment, or legal advice. Gate does not guarantee the accuracy or completeness of the information and shall not be liable for any losses arising from the use of this information. Virtual asset investments carry high risks and are subject to significant price volatility. You may lose all of your invested principal. Please fully understand the relevant risks and make prudent decisions based on your own financial situation and risk tolerance. For details, please refer to
Disclaimer.
Related Articles
The RWA Yield Infrastructure Trade
The essay highlights challenges in direct RWA token exposure, emphasizes the potential in leverage opportunities amid settlement delays, critiques Morpho's governance token structure, and presents Fluid as a more effective token model with stablecoin links.
CoinDesk9m ago
Bitcoin ETF ends a run of seven consecutive red days, and renewed pressure returns to the Bitcoin price
After U.S. spot Bitcoin ETFs saw net inflows for seven consecutive trading days, they have recently switched to outflows, indicating that fund flows have become more cautious. Bitcoin’s price briefly fell below $70,000, reflecting weakness in market sentiment and liquidity. ETF outflows stem from investors re-evaluating the macro environment; amid expectations for high interest rates and geopolitical risks, investors’ risk appetite has declined. $70,000 has become a short-term line between bulls and bears, and technical indicators show that market confidence still needs to be restored.
区块客13m ago
Tom Lee: The stock market has already digested 90% of the sell-off pressure; the initial stage of the U.S.-Iran conflict was already at the bottom
Tom Lee said in an interview on CNBC that the stock market has absorbed 90% to 95% of the selling pressure and may be in the process of rebuilding a base. He analyzed historical data and noted that, beginning in the early stages of wars since 1900, stock markets typically bottom out. He predicts that the crypto market may end the winter by the end of April, but there is disagreement in the market about the timing of the bottom, and analysts have differing views. Lee also noted that excessive deleveraging could lead to a V-shaped rebound.
MarketWhisper18m ago
These catalysts could bump bitcoin as Trump hands three-week target to end Iran war
Asian stocks posted their best day in months and S&P 500 futures jumped after the president said he would address the nation Wednesday night with an "important update" on Iran. Oil pared losses as the UAE reportedly prepares to help reopen the Strait of Hormuz by force.
Bitcoin traded at $67,950 on
CoinDesk33m ago
Are Trump’s expectations of an Iran war heating up after three weeks—are the catalysts for Bitcoin’s rise continuing to accumulate?
As expectations grow that a Trump-led Iran war will end within two to three weeks, global risk-asset sentiment has rebounded. Bitcoin is holding at $67,950, Asia-Pacific equities are performing strongly, and overall market risk appetite has recovered. Institutional capital is flowing into the crypto market, which could push Bitcoin toward a clear direction. The market is waiting for Trump’s key speech to confirm the trend.
GateNews36m ago
Sell-off warning lights are flashing red! 47% of circulating Bitcoin has been “trapped,” and long-term holders are also taking losses and cashing out
The cryptocurrency market is facing a cold wind: nearly half of Bitcoin has already fallen below its cost basis, and long-term investors have also begun to realize losses and sell. The Bitcoin Impact Index rose to 57.4, indicating that market pressure is intensifying; historically, similar situations have signaled that large-scale sell-offs are about to come. Short-term holders are down 47%, capital momentum has weakened, and stablecoin outflows have turned into net inflows in reverse.
区块客43m ago
