
Key Takeaways:
-
Ondo (ONDO) is trading near a critical support zone around $0.32 after a sharp market-wide sell-off.
-
The daily chart shows a right-angled descending broadening wedge, a pattern often linked to potential bullish reversals.
-
Buyers are defending the lower wedge boundary, suggesting selling pressure may be weakening.
-
The 100-day moving average near $0.53 remains a major resistance that must be reclaimed for trend reversal confirmation.
-
A successful rebound could open the door for a recovery toward the $1.10–$1.17 resistance zone, while a breakdown below $0.32 would invalidate the bullish setup.
The real-world asset (RWA) token Ondo (ONDO) is trading under pressure near $0.35, extending its short-term downtrend amid a broader crypto market sell-off. The latest wave of weakness follows escalating US–EU trade tensions, which sparked over $851 million in long liquidations, dragging major assets like Bitcoin (BTC) and Ethereum (ETH) down by roughly 2.5% and 4.5%, respectively, over the past 24 hours.
ONDO itself is down 5.98% at the time of writing. However, despite the bearish momentum, the daily chart suggests price is approaching a technically important zone where a potential rebound setup could begin to form.
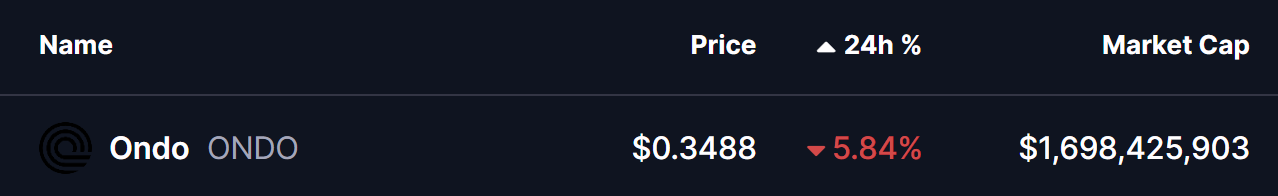
Source: Coinmarketcap
Right-Angled Descending Broadening Wedge in Focus
From a technical perspective, Ondo’s daily chart is carving out a right-angled descending broadening wedge, a pattern that often appears during extended corrective phases and can precede bullish reversals if support holds.
This structure has been developing since ONDO’s rejection from the neckline resistance zone around $1.00–$1.17 back in September 2025. Since then, price has continued to print lower highs while gradually expanding volatility, pushing ONDO down toward the lower boundary of the wedge near $0.32.
Notably, selling pressure appears to be easing near this zone. Buyers have stepped in to defend the level, with ONDO currently hovering slightly above it around $0.348 — a sign that demand may be emerging after weeks of sustained downside.
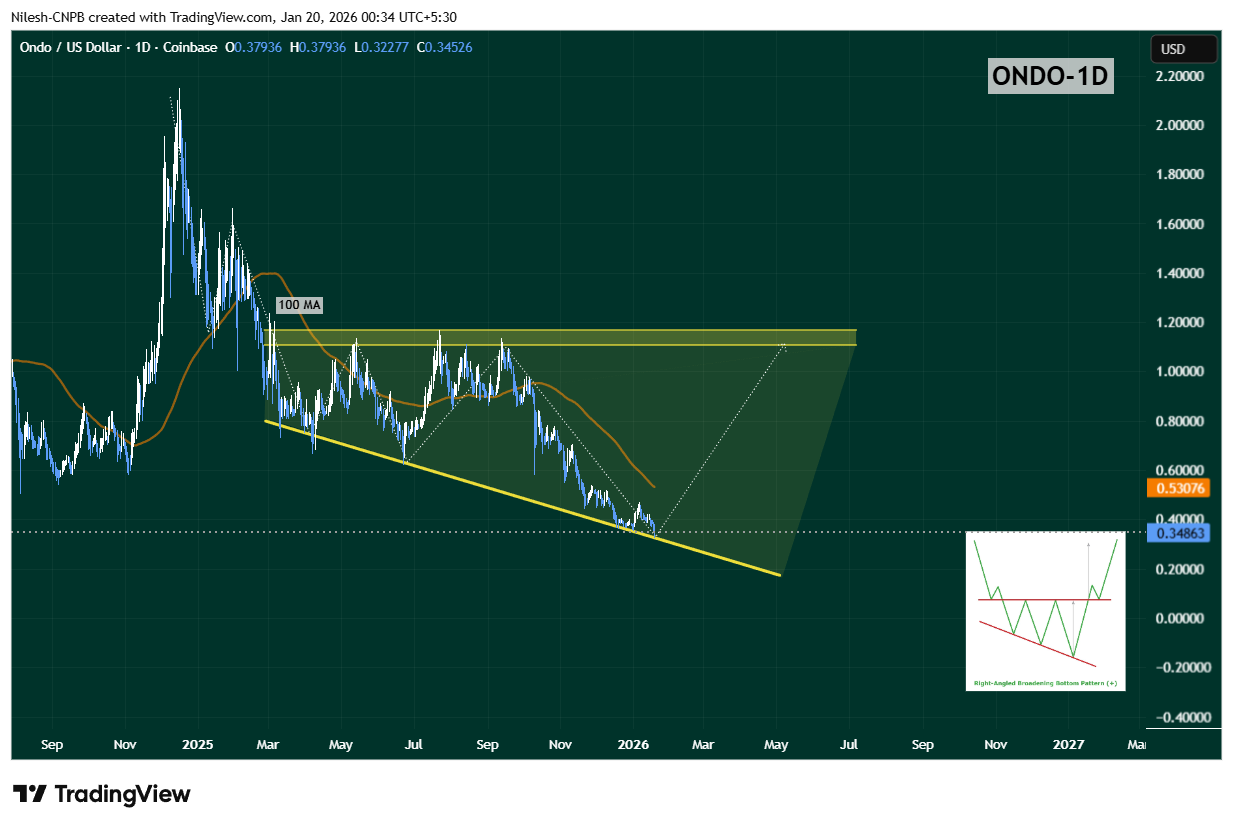
Ondo (ONDO) Daily Chart/Coinsprobe (Source: Tradingview)
While the lower wedge support is holding for now, upside momentum remains constrained. The 100-day moving average, currently positioned near $0.53, has flipped into strong overhead resistance. Each prior rally attempt has stalled below this level, reinforcing its importance as a confirmation point for any meaningful trend reversal.
Until ONDO can reclaim this moving average, any bounce should be viewed as a relief rally within a broader consolidation, rather than a confirmed rebound.
What’s Next for ONDO?
As long as ONDO continues to defend the $0.32 support zone, the right-angled descending broadening wedge remains technically valid. Sustained holding above this level keeps the door open for a rebound attempt, particularly if price begins forming higher daily or weekly closes.
A successful reclaim of the 50-day moving average, followed by a breakout above the 100-day MA, would mark a clear shift in momentum. If that scenario unfolds, ONDO could gradually work its way back toward the upper boundary of the wedge, which currently aligns near the $1.10–$1.17 region — a level that would represent a significant recovery from current prices.
On the flip side, a decisive breakdown below $0.32 would invalidate the bullish wedge structure and likely expose ONDO to another leg of downside or prolonged consolidation.
Bottom Line
Ondo is currently sitting at a critical technical crossroads. While broader market sentiment remains fragile, the chart suggests ONDO is testing a zone where seller exhaustion could give way to a bounce. The next few sessions will be crucial. How price reacts around the lower wedge support will likely determine whether ONDO can stage a meaningful rebound — or whether bears retain control for longer.
Disclaimer: The views and analysis presented in this article are for informational purposes only and reflect the author’s perspective, not financial advice. Technical patterns and indicators discussed are subject to market volatility and may or may not yield the anticipated results. Investors are advised to exercise caution, conduct independent research, and make decisions aligned with their individual risk tolerance.
About Author: Nilesh Hembade is the Founder and Lead Author of Coinsprobe, with over 5 years of experience in the cryptocurrency and blockchain industry. Since launching Coinsprobe in 2023, he has been providing daily, research-driven insights through in-depth market analysis, on-chain data, and technical research.
Disclaimer: The information on this page may come from third parties and does not represent the views or opinions of Gate. The content displayed on this page is for reference only and does not constitute any financial, investment, or legal advice. Gate does not guarantee the accuracy or completeness of the information and shall not be liable for any losses arising from the use of this information. Virtual asset investments carry high risks and are subject to significant price volatility. You may lose all of your invested principal. Please fully understand the relevant risks and make prudent decisions based on your own financial situation and risk tolerance. For details, please refer to
Disclaimer.
Related Articles
Next Crypto Breakout: 3 Altcoins Poised for Massive Upside
CHZ breaks resistance with strong volume, driven by sports and fan engagement demand.
XMR hits all-time high, fueled by privacy demand and strong trading volume.
ATOM rebounds from lows, holding support while building momentum toward higher resistance levels.
The crypto market
CryptoNewsLand44m ago
Kalshi Traders Forecast XRP to Hit $1.60 in April
Kalshi traders predict XRP will reach $1.60 in April amid rising demand and significant ETF inflows. With a bullish technical outlook and upcoming regulatory votes, XRP's market dynamics show potential for further gains, despite risks of declining support levels if outcomes are unfavorable.
CryptoFrontier2h ago
Solana Adoption Surges to 167M While Usage and Price Diverge
Key Insights
Solana reached 167 million holders, signaling strong adoption growth even as active addresses declined, showing a widening gap between ownership and usage trends.
Institutional interest increased as DeFi Development Corp accumulated over 2.22 million SOL, reinforcing long-term c
CryptoNewsLand4h ago
Shiba Inu Forecast: Range-bound Moves Shift After Bullish Golden Cross
SHIB consolidates near $0.0000058 amid declining volume and reduced market participation.
Bullish golden cross signals short-term momentum shift despite ongoing range-bound price action.
Key support at $0.00000562 holds focus, with breakout targets near $0.00000625 and higher.
Shiba
CryptoNewsLand6h ago
Pudgy Penguins Price Analysis: $0.008 Could Trigger the Next Big Move
PENGU shows steady growth, signaling accumulation rather than short-term speculation.
Buyers dominate spot and futures markets, strengthening current bullish momentum.
$0.008 resistance remains key, with breakout or consolidation likely next.
Pudgy Penguins — PENGU, has started showing a
CryptoNewsLand7h ago
The Strait of Hormuz is fully reopened, and Bitcoin surged to 78K. MicroStrategy (MSTR) jumped 12%.
Iran announces that the Strait of Hormuz is fully open; oil prices fall sharply as supply concerns ease, and U.S. stock indexes hit record highs. Bitcoin once surged to $78,333 and lifted MicroStrategy’s stock price by 12% in a big jump. Market-wide sentiment improves, and cryptocurrencies also show signs of capital inflows.
ChainNewsAbmedia12h ago
