
Key Takeaways
-
GALA gains as gaming tokens regain market momentum
-
Total Value Locked jumps 199% in a single day
-
Bullish descending broadening pattern forms on daily chart
-
Price reclaims 50-day moving average, signaling trend shift
-
Breakout above $0.0079 could open path toward $0.0099
Gaming-focused crypto tokens are quietly returning to the spotlight as risk appetite improves across the market. Axie Infinity (AXS) surged more than 21% in a single day, reviving interest in the gaming narrative. Riding that momentum, Gala (GALA) has also stepped into focus, gaining nearly 3% as the broader crypto market shows renewed strength on January 14, 2026.
Beyond price action, strong TVL growth and a bullish chart structure suggest GALA may be setting up for an upside continuation if key resistance levels are cleared.
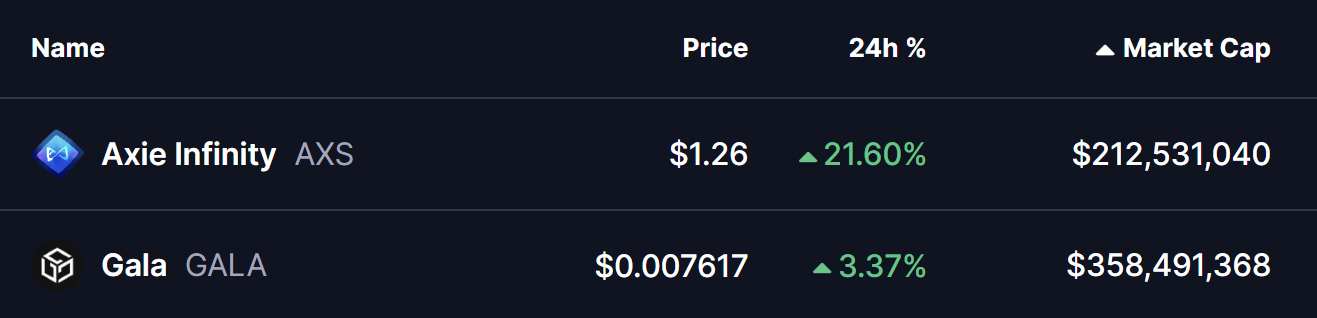
Source: Coinmarketcap
Strong TVL Growth Signals Renewed Network Activity
As momentum builds across gaming tokens, Gala’s ecosystem activity has surged sharply. Data shows GALA’s total value locked (TVL) jumped by nearly 203% in a single day, while the 30-day TVL increase stands at approximately 135%.

Gala Chain TVL/Source: Defillama
Such rapid expansion in locked value often reflects rising participation, increased utility, and renewed confidence in the underlying network — all of which tend to strengthen the case for sustained price recovery when paired with improving technicals.
Right-Angled Descending Broadening Pattern in Play
From a technical perspective, GALA’s daily chart is printing a right-angled descending broadening formation, a structure commonly associated with bullish reversals after prolonged consolidation.
For several weeks, price action remained capped beneath the $0.0076–$0.0079 resistance zone, with repeated upside attempts facing rejection. At the same time, the downside swings gradually expanded, creating the widening lower trendline characteristic of this pattern.
This structure began to shift following a strong rebound from the lower boundary. Buyers stepped in decisively, pushing GALA higher and enabling a reclaim of the 50-day moving average near $0.00691 — a level that had previously acted as persistent dynamic resistance.
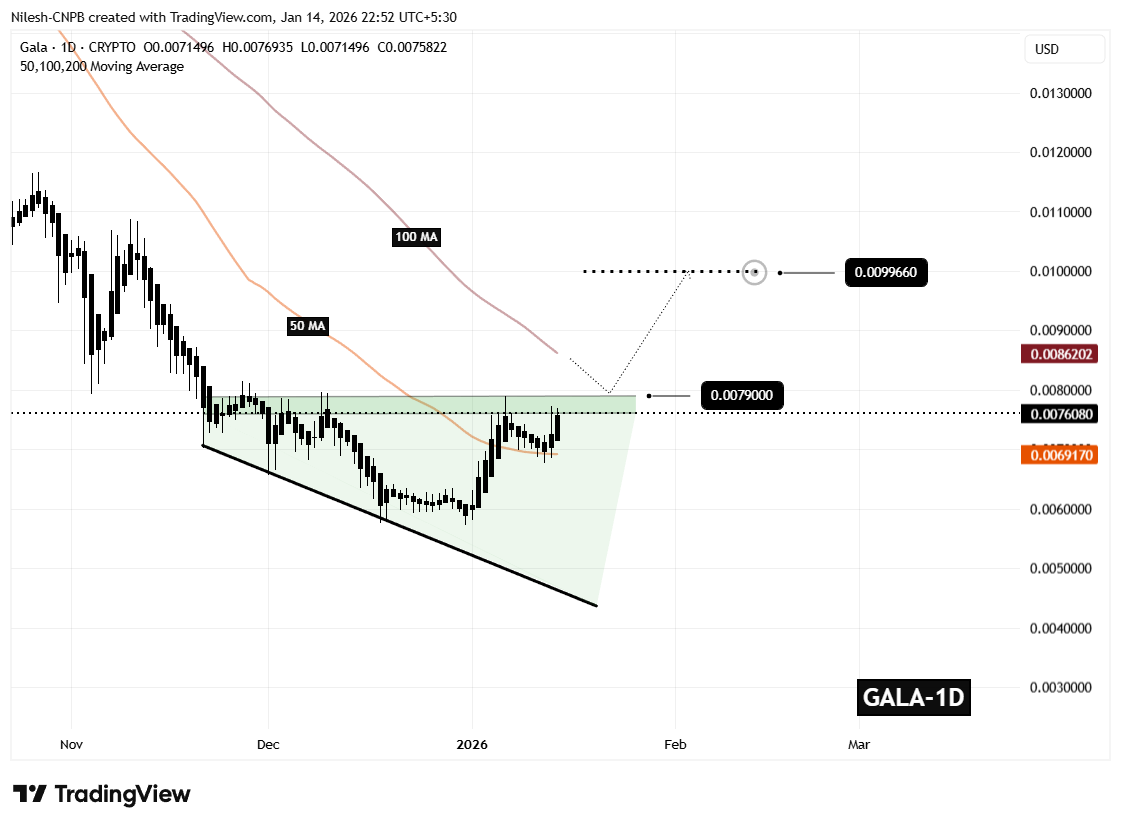
Gala (GALA) Daily Chart/Coinsprobe (Source: Tradingview)
Since then, upside momentum has continued to build, bringing price back into the same resistance band that previously capped rallies. GALA is now trading at a critical inflection zone, where the next directional move is likely to be defined.
What’s Next for GALA?
A decisive daily close above the $0.0079 resistance, followed by a successful retest, would confirm a breakout from the descending broadening formation and validate the broader bullish reversal setup.
Based on the depth of the pattern and its measured-move projection, a confirmed breakout could open the door toward the $0.00996 region, implying a potential upside of roughly 31% from current levels.
However, patience remains key. Until confirmation occurs, short-term pullbacks remain possible, including a retest of the 50-day moving average. Such moves would not invalidate the bullish structure as long as higher lows continue to form.
For now, the $0.0076–$0.0079 zone stands as the market’s decision area. How GALA behaves around this range will determine whether it transitions into a sustained bullish phase or remains range-bound in the near term.
Bottom Line
Gala (GALA) is approaching a key technical decision zone as rising TVL and a bullish chart structure align. A confirmed breakout could trigger a strong upside move, while failure may lead to short-term consolidation.
Disclaimer: The views and analysis presented in this article are for informational purposes only and reflect the author’s perspective, not financial advice. Technical patterns and indicators discussed are subject to market volatility and may or may not yield the anticipated results. Investors are advised to exercise caution, conduct independent research, and make decisions aligned with their individual risk tolerance.
About Author: Nilesh Hembade is the Founder and Lead Author of Coinsprobe, with over 5 years of experience in the cryptocurrency and blockchain industry. Since launching Coinsprobe in 2023, he has been providing daily, research-driven insights through in-depth market analysis, on-chain data, and technical research.
Disclaimer: The information on this page may come from third parties and does not represent the views or opinions of Gate. The content displayed on this page is for reference only and does not constitute any financial, investment, or legal advice. Gate does not guarantee the accuracy or completeness of the information and shall not be liable for any losses arising from the use of this information. Virtual asset investments carry high risks and are subject to significant price volatility. You may lose all of your invested principal. Please fully understand the relevant risks and make prudent decisions based on your own financial situation and risk tolerance. For details, please refer to
Disclaimer.
Related Articles
Shiba Inu Price Analysis: Layer 3 Innovation and Bullish Momentum Ahead
Shiba Inu shows recovery signs with key support holding and rising trading volume.
Shibarium and Layer-3 upgrades strengthen utility, privacy, and ecosystem expansion across the network.
Burn mechanisms and government-linked holdings add attention and long-term market interest.
Shiba Inu
CryptoNewsLand40m ago
A huge Ethereum whale moves 2,000 ETH, seemingly preparing to sell
On April 17, an on-chain analyst, Ai Auntie, disclosed on the X platform that a long-term whale who has held a large amount of tokens since the Ethereum ICO period transferred 2,000 ETH (about $4.63 million) to a multi-signature address. The receiving address has been identified as a “designated sell” address in its history—funds are typically deposited to an exchange shortly after the transfer.
MarketWhisper4h ago
Trump Announces Israel-Lebanon Ceasefire as Bitcoin Reclaims $75,000
April 17, Bitcoin returned to around $75,000 as U.S. President Trump announced a 10-day ceasefire agreement between Israel and Lebanon, boosting market sentiment. However, a CryptoQuant report shows that the proportion of large deposits has surged to over 40%, suggesting institutions may be preparing to sell. In addition, Bitcoin faces key technical resistance in the $76,000 to $76,800 range, and the market remains cautious about how events will unfold next.
MarketWhisper6h ago
Optimism boosted by the U.S.-Iran ceasefire agreement helps Bitcoin hold steady at 75K
Israel and Lebanon reached a 10-day ceasefire agreement, U.S. stock index benchmarks hit new highs, and market sentiment is optimistic. Bitcoin is hovering around 75K; with capital flowing in, the rally is gradually gaining momentum. Keep an eye on the 78K resistance level.
ChainNewsAbmedia7h ago
Bitcoin Hovers Near $75K as Whales Accumulate 270K BTC Over 30 Days, Largest Since 2013
Bitcoin nears $75,000, driven by significant whale accumulation of 270,000 BTC and low exchange reserves. Despite fluctuations and negative funding rates, it rebounded after geopolitical news, with futures inflows increasing since March.
GateNews9h ago
