
Date: Wed, Dec 31, 2025 | 03:40 PM GMT
As the final hours of 2025 approach, the broader cryptocurrency market is showing modest strength. Both Bitcoin (BTC) and Ethereum (ETH) are trading slightly in the green, helping ease recent volatility and stabilize overall market sentiment. This calmer environment has allowed select altcoins — including Plasma (XPL) — to begin forming constructive technical setups after extended periods of downside pressure.
XPL is starting to attract attention with an impressive 11% daily jump, trimming its 60-day decline to roughly 43%. While the broader trend still reflects recovery mode, the more important signal is emerging on the daily chart, where price action is beginning to suggest a meaningful structural shift. If confirmed, this setup could mark the early stages of a bullish continuation heading into the new year.
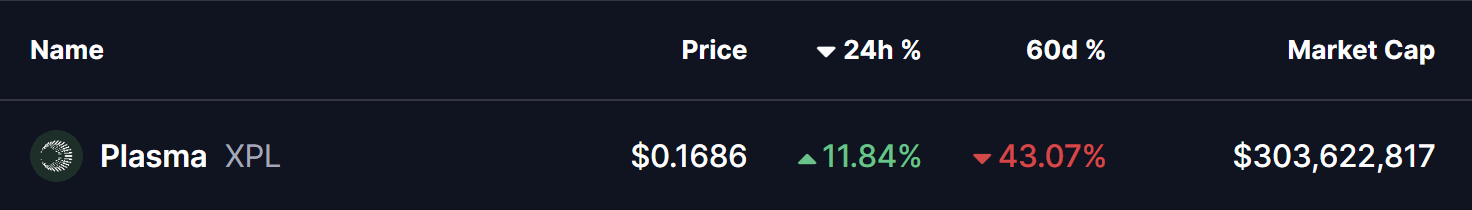
Source: Coinmarketcap
Rounding Bottom in Play
On the daily timeframe, XPL appears to be forming a textbook rounding bottom pattern — a classic bullish reversal structure that typically develops after a prolonged downtrend. This pattern reflects a slow but steady transition from selling dominance to accumulation, as bearish momentum fades and buyers gradually regain control.
Earlier in the trend, XPL faced strong rejection near the $0.3321 neckline zone, triggering a sharp decline that extended through November and December. That sell-off ultimately found a floor near the $0.1152 level, which has since proven to be a critical demand zone. Repeated defenses of this area prevented further downside and laid the foundation for a potential trend reversal.
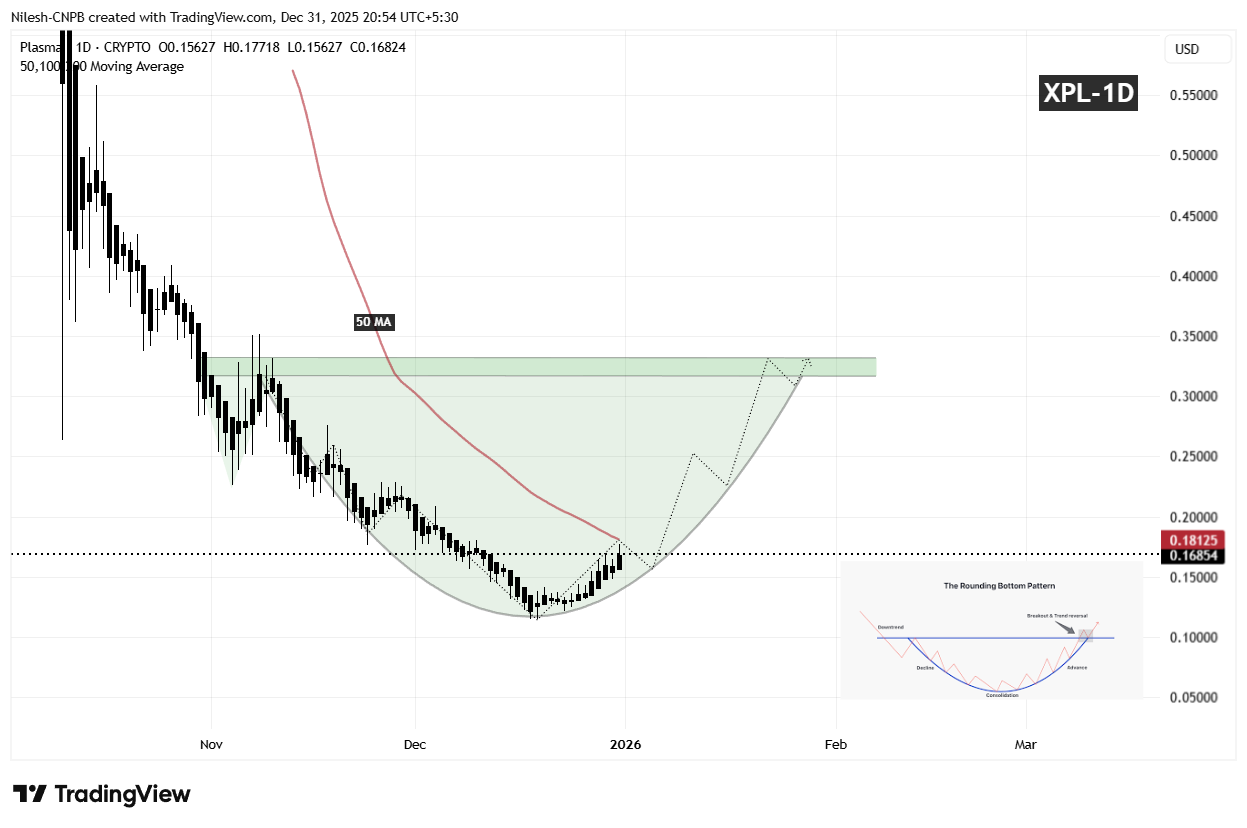
XPL Daily Chart/Coinsprobe (Source: Tradingview)
Since establishing that base, XPL has begun to curve higher in a rounded fashion, mirroring the classic structure of a developing bottom. This gradual recovery suggests that selling pressure is no longer aggressive, and that accumulation is taking place beneath the surface. The recent push back above the $0.16 region further reinforces the idea that buyers are positioning ahead of a larger directional move.
What’s Next for XPL?
For the rounding bottom pattern to gain confirmation, XPL needs to reclaim the 50-day moving average, currently positioned near the $0.1812 level. A sustained move above this area would signal a clear momentum shift and indicate that bulls are regaining control after months of corrective price action.
Looking higher, the most significant technical barrier remains the neckline resistance around $0.3321, highlighted by the prior distribution zone on the chart. A clean breakout above this region would validate the entire reversal structure and could open the door for a broader bullish expansion phase, with momentum traders and sidelined participants likely re-entering the market.
Until those levels are reclaimed, the pattern remains in its development phase. Short-term consolidation or minor pullbacks remain possible if price struggles near the 50-day moving average. However, as long as XPL continues to hold higher lows above the $0.1152 base, the broader bottoming structure remains intact.
Overall, XPL is approaching a technically important inflection point. The emerging rounding bottom formation, improving price structure, and proximity to key resistance levels suggest the coming sessions could prove decisive for Plasma’s next major directional move as the market transitions into 2026.
Disclaimer: The views and analysis presented in this article are for informational purposes only and reflect the author’s perspective, not financial advice. Technical patterns and indicators discussed are subject to market volatility and may or may not yield the anticipated results. Investors are advised to exercise caution, conduct independent research, and make decisions aligned with their individual risk tolerance.
About Author: Nilesh Hembade is the Founder and Lead Author of Coinsprobe, with over 5 years of experience in the cryptocurrency and blockchain industry. Since launching Coinsprobe in 2023, he has been providing daily, research-driven insights through in-depth market analysis, on-chain data, and technical research.
Disclaimer: The information on this page may come from third parties and does not represent the views or opinions of Gate. The content displayed on this page is for reference only and does not constitute any financial, investment, or legal advice. Gate does not guarantee the accuracy or completeness of the information and shall not be liable for any losses arising from the use of this information. Virtual asset investments carry high risks and are subject to significant price volatility. You may lose all of your invested principal. Please fully understand the relevant risks and make prudent decisions based on your own financial situation and risk tolerance. For details, please refer to
Disclaimer.
Related Articles
XRP Begins Era as Commodity Under US Laws, Stuart Alderoty Reacts - U.Today
Stuart Alderoty, Ripple's CLO, welcomes the SEC's reclassification of XRP as a commodity, suggesting it could enhance adoption and ease exchange listings. Despite a recent price drop, XRP remains above key support levels, although trading volume has significantly decreased.
UToday17m ago
QCP: BTC Oscillates Near $74,000; Multi-Country Central Bank Rate Decisions Key This Week
QCP Capital analysis indicates that BTC price is maintaining around $74,000, with a lack of upward momentum. Although the overall crypto market remains under pressure, the declines are relatively controlled. Central bank policy meetings throughout the year will influence the market, as high oil prices have lowered expectations for rate cuts, and the interest rate environment has weakened support for crypto assets. Until policy and geopolitical situations become clearer, a volatile pattern may continue.
GateNews1h ago
Analyst: The overheated bubble of Bitcoin (BTC) has been absorbed, but selling pressure still remains.
On-chain analyst Axel's research report indicates that the Bitcoin market has returned to a neutral range, but overall remains in a loss state with unrelenting selling pressure. The MVRV Z-Score shows that valuation bubbles have dissipated; however, aSOPR has remained below 1.0 for 55 consecutive days, indicating sustained selling pressure. Axel emphasizes that the key to the market lies in whether selling pressure will be exhausted, requiring observation of whether aSOPR can stabilize above 1.0.
動區BlockTempo2h ago
Citigroup Slashes Bitcoin and Ethereum 12-Month Price Targets, Citing Stalled U.S. Crypto Legislation Weighing on Upside Catalysts
Citigroup has lowered its 12-month price targets for Bitcoin and Ethereum, signaling a shift toward caution on the cryptocurrency market's medium-term outlook, primarily due to slow progress in U.S. crypto asset legislation. Bitcoin's target was reduced from $143,000 to $112,000, while Ethereum's fell to $3,175. Despite upside potential remaining in the future, the lack of new policy catalysts suggests prices may oscillate within a range in the near term. Citigroup's assessment of Ethereum is more cautious, as it believes the asset is more significantly impacted by on-chain activity.
区块客2h ago
Bitcoin Holds Strong at $70,000! On-Chain Data Reveals "Collective Selling Wave," Retail Investors Emerge as Biggest Selling Pressure
Under Middle East geopolitical tensions, Bitcoin faced widespread selling pressure, particularly from retail holders. According to Glassnode data, the market is experiencing heavy selling pressure, with the accumulated trend score declining to 0.04, indicating that retail and small-to-medium investors are reducing their positions significantly. Despite this, Bitcoin's resilience against the decline has surprised market observers.
区块客3h ago
ENJ Rockets Past $0.027 — 23% Surge Signals Momentum
Enjin Coin has surged 22.96% in 30 minutes, reaching $0.02737, reflecting increased trading activity and market interest. With a 24-hour change of +43.30%, traders are monitoring support at $0.025 and resistance at $0.030, suggesting potential trends ahead.
Coinfomania3h ago
