BONK experienced a remarkable growth this week, with a price increase of approximately 46% over the past seven days—outperforming most other meme coins. However, price volatility has not fully reflected what is happening. Upon deeper analysis, it can be observed that the number of new users has surged, large wallets have been accumulating early, and the price structure still has room to continue upward. Nevertheless, the upward momentum may temporarily pause before continuing.
The key point is not the continuous daily price increase, but whether buying pressure can sustain after the initial breakout.
BONK User Activity Surges Alongside Price
An important indicator is the number of active addresses. This metric shows the number of unique wallets conducting BONK transactions each day. When this number increases, it usually indicates that more people are actively using or holding the token, rather than just engaging in short-term trading.
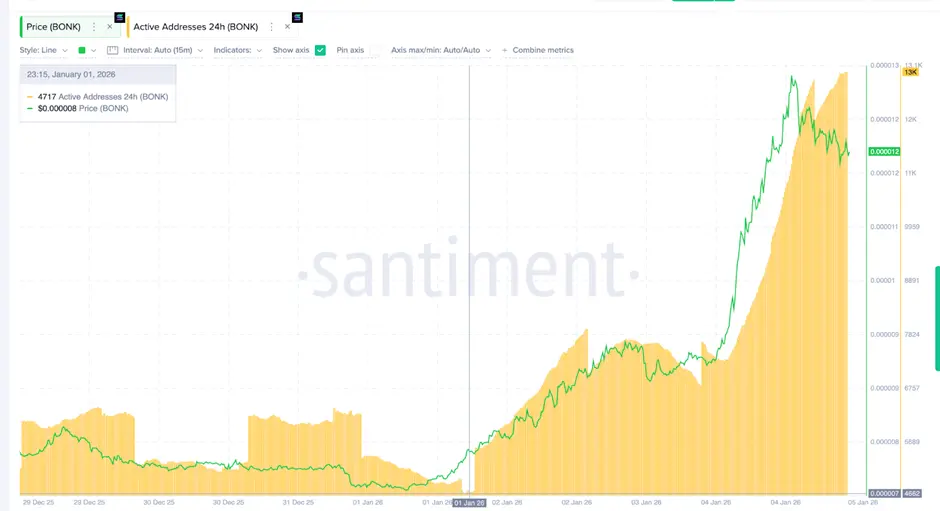 Active Addresses | Source: SantimentIn early January, BONK recorded around 4,700 active addresses. By January 5th, this number nearly tripled to nearly 13,000 addresses. This is an impressive growth in a short period.
The significance of this lies in the fact that many meme coin price rallies often fail when they only attract short-term traders. When wallet activity increases significantly like now, it indicates genuine and broader interest. Even if BONK’s price temporarily stalls, the increase in activity still supports a positive trend.
As of now, BONK’s usage has grown in tandem with its price, indicating a solid foundation for an upward trend.
Large Wallets Early Accumulation, Then Pausing
Another factor to observe is the behavior of “whales”—wallets holding large amounts of tokens. For BONK, this group includes wallets holding from 100 million BONK to 1 billion BONK.
Since December 31st, the total BONK held by these wallets increased from approximately 2.7227 trillion BONK to 2.7321 trillion BONK, adding about 9.41 billion BONK during the initial phase of the rally.
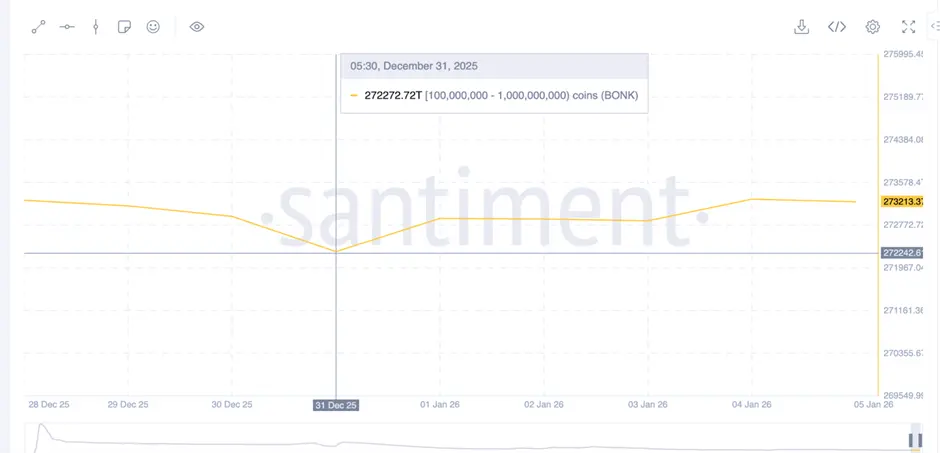 BONK Whales | Source: SantimentAfterward, the holdings of large wallets remained almost unchanged. This does not mean they sold, but simply that they stopped buying at higher prices.
This is a common strategy among large investors: buy early when prices are low, then observe as the market heats up. They often wait for stability before making their next move.
Currently, there are no clear signs of these large wallets divesting. They continue to hold the BONK they accumulated earlier.
BONK Price Structure Still Shows Growth Potential
The BONK price chart shows a strong rally followed by sideways movement, reflecting a pause among buyers after a breakout.
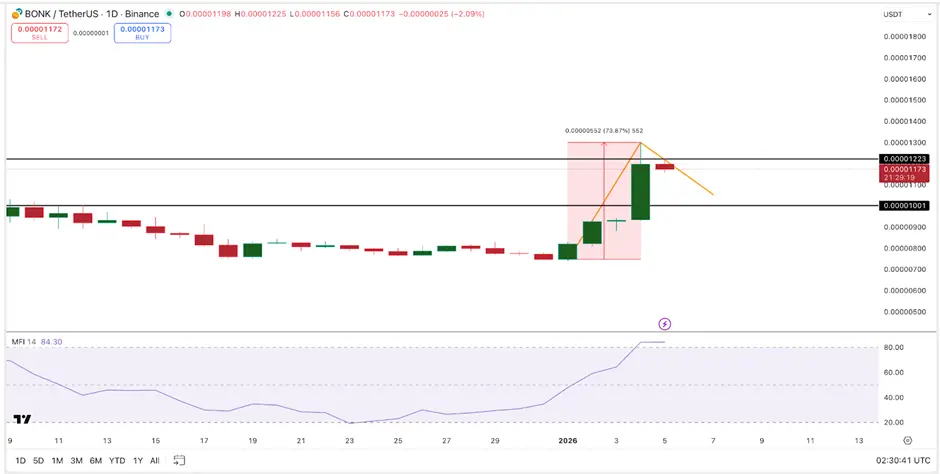 BONK Price Action | Source: TradingView As long as BONK stays above the $0.000010 level, this price structure remains intact. If the price breaks above $0.000012, it would signal that buying pressure continues to dominate. Conversely, if the price drops below $0.000010, the upward trend could reverse.
In terms of potential, the previous rally allows for an estimated growth of up to approximately 74%, if BONK continues its upward trend in the near future.
However, the (MFI) money flow index also indicates a possible correction. This index has entered overbought territory and has been sideways recently, signaling expectations of a price correction that could attract more buying interest at lower levels.
Some meme coin market analysts also point out an important confirmation threshold: if BONK surpasses $0.00001687, the next bullish trend could be triggered. Before reaching this level, minor corrections or sideways oscillations are considered normal.
For short-term support, the $0.00001069 zone is crucial and aligns with the TCR price chart. If BONK approaches this zone without dropping further, it is still viewed as a positive development after a strong rally.
Disclaimer: The information on this page may come from third parties and does not represent the views or opinions of Gate. The content displayed on this page is for reference only and does not constitute any financial, investment, or legal advice. Gate does not guarantee the accuracy or completeness of the information and shall not be liable for any losses arising from the use of this information. Virtual asset investments carry high risks and are subject to significant price volatility. You may lose all of your invested principal. Please fully understand the relevant risks and make prudent decisions based on your own financial situation and risk tolerance. For details, please refer to
Disclaimer.
Related Articles
Bitcoin Uptrend Likely by Late 2026, Says Scaramucci
The latest downturn in Bitcoin has sparked fresh debate across the crypto market. However, according to Anthony Scaramucci, the explanation may be far less surprising than many expect. The SkyBridge Capital managing partner believes the current pullback is simply part of Bitcoin’s long-standing
Coinfomania24m ago
Panic sentiment surges, "hedging costs" reach new highs! VanEck: Bitcoin may be approaching a reversal point
VanEck's research shows that the Bitcoin market is currently in a state of extreme anxiety. Despite rising hedging costs, traders are actively seeking downside protection. The report points out that while leverage and volatility have decreased, the options market is displaying panic signals, with put premiums reaching new highs. However, historical data suggests that extreme panic often precedes a rebound, and significant market turning points may emerge in the future.
区块客28m ago
TRUMP Token May Test Historical Lows Again? $70 Million Sell Pressure Incoming, $3 Level in Jeopardy
Trump token TRUMP has continued to decline recently, with the current price at $3.21, down 1.32% intraday and approaching its historical low of $2.705. On-chain data shows selling pressure has not been fully released, with significant major capital outflows. Technical analysis indicates that if the trend continues, the price could decline to $2.71, with $3.00 serving as psychological support. Market sentiment has turned cautious.
GateNews29m ago
MICA Daily | Why Have Stocks Fallen While Crypto Has Risen Recently? Analyzing the Truth Behind the Decoupling
Since October 2025, the positive correlation between Bitcoin and the S&P 500 Index has significantly weakened, entering a decoupling phase. This change stems from large-scale liquidation events, depressed market liquidity, and reduced risk appetite among traders. Meanwhile, ETF outflows and geopolitical tensions have also impacted Bitcoin's performance, demonstrating that its potential as a safe-haven asset is gradually increasing as deleveraging comes to an end.
区块客31m ago
Bitcoin Rebound Timeline Exposed: Scaramucci Says Q4 May Launch New Bull Market, $1 Million Target Unchanged
Under geopolitical risks and macroeconomic pressures, Bitcoin's price has broken below $68,000. Anthony Scaramucci, founder of SkyBridge Capital, believes this represents a typical cyclical pullback and anticipates Bitcoin may rally again in 2026. Despite short-term market risks, long-term bullish sentiment remains solid.
GateNews32m ago
Bitcoin Potentially Dips to $62,000? Mega Whales Counter-Trend Accumulation Hits One-Year High, Long-Short Battle Intensifies
Bitcoin broke below the head and shoulders neckline on March 23rd, with prices sliding to around $68,100. The downside target is expected at $62,200. Despite coin holders increasing positions and RSI forming a divergence signal, the market is still facing selling pressure. $69,500 serves as a key support level, and future trends will depend on the battle over key price levels.
GateNews35m ago
