
Date: Fri, Jan 02, 2026 | 10:54 AM GMT
The broader cryptocurrency market has started the new year with modest strength, as both Bitcoin (BTC) and Ethereum (ETH) trade slightly higher with gains of over 2%. This renewed stability across majors has helped improve overall sentiment, allowing several altcoins to regain momentum — including Aster (ASTER).
ASTER is currently trading around 4% higher on the day, but the more important development lies beneath the surface. On lower timeframes, price action is beginning to highlight a constructive bullish structure, suggesting that the token may be preparing for a meaningful breakout if the setup confirms.
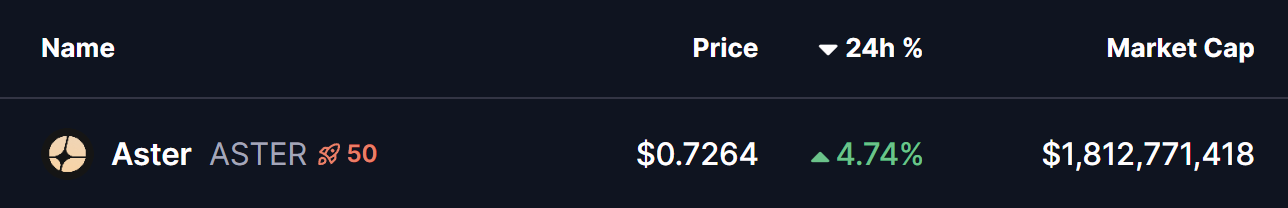
Source: Coinmarketcap
Ascending Triangle Structure Takes Shape
On the 4-hour chart, ASTER is forming a clear ascending triangle, defined by a series of higher lows pressing steadily against a horizontal resistance zone. This type of structure is widely regarded as a bullish continuation pattern, particularly when it develops during consolidation and shows consistent buyer accumulation at rising support levels.
ASTER recently faced rejection near the $0.7367 neckline resistance, which pushed price back toward its ascending support trendline around the $0.68 region. Importantly, each dip has been met with strong buying interest, preventing any deeper pullback and keeping the bullish structure intact. This behavior indicates that sellers are gradually losing control as buyers step in earlier on every retracement.
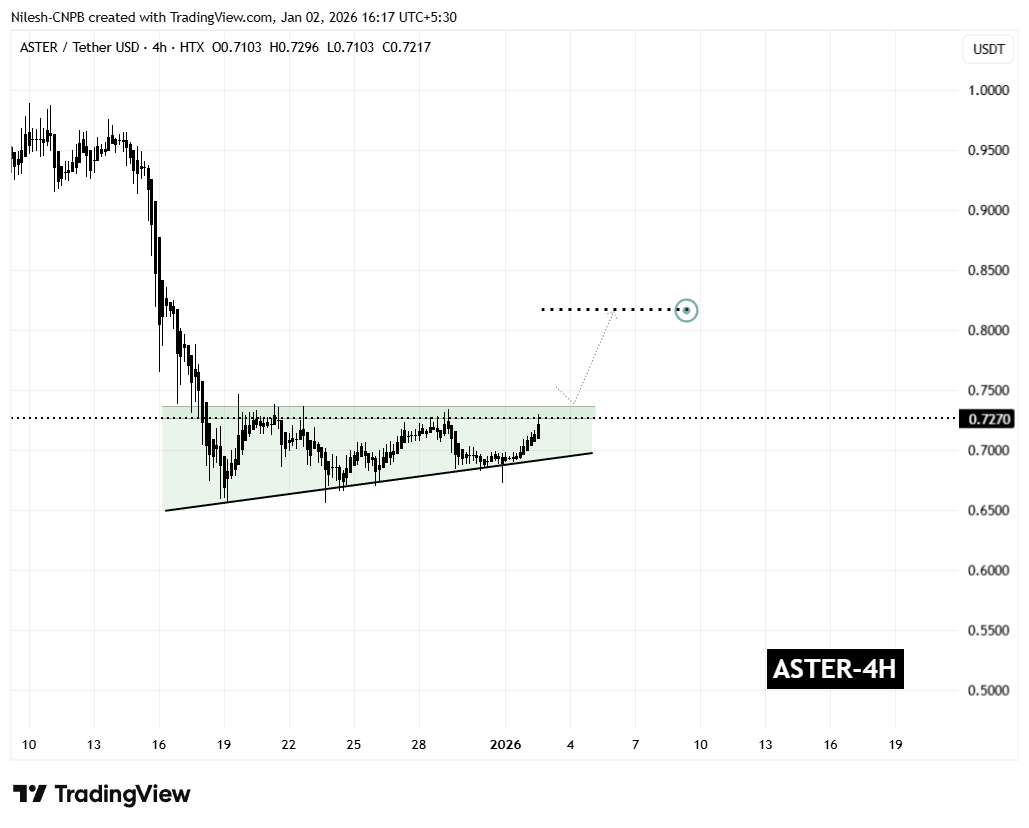
Aster (ASTER) 4H Chart/Coinsprobe (Source: Tradingview)
The latest rebound has once again carried ASTER toward the upper boundary of the triangle, reinforcing the idea that demand remains firm. Rather than signaling weakness, this sideways-to-higher price action reflects healthy consolidation as volatility tightens ahead of a potential breakout.
What’s Next for ASTER?
From here, ASTER appears to be preparing for another test of the $0.7367 resistance zone. A decisive breakout above this level, followed by a sustained close and a successful retest as support, would confirm the ascending triangle pattern and likely trigger a bullish expansion phase.
Based on the measured move of the formation, the technical upside projection points toward the $0.8178 region. This target represents a potential upside of roughly 12% from current levels and also aligns with previous price structure, adding further confidence to the bullish outlook.
That said, caution remains warranted. If ASTER fails to break above resistance, price could once again drift back toward the rising support trendline. As long as this trendline continues to hold, the broader bullish setup remains valid. A decisive breakdown below support, however, would invalidate the pattern and postpone any breakout scenario.
For now, the combination of improving market sentiment, consistent dip-buying, and a tightening ascending triangle structure suggests that Aster is approaching a critical decision point — one that could define its next significant move as 2026 begins.
Disclaimer: The views and analysis presented in this article are for informational purposes only and reflect the author’s perspective, not financial advice. Technical patterns and indicators discussed are subject to market volatility and may or may not yield the anticipated results. Investors are advised to exercise caution, conduct independent research, and make decisions aligned with their individual risk tolerance.
About Author: Nilesh Hembade is the Founder and Lead Author of Coinsprobe, with over 5 years of experience in the cryptocurrency and blockchain industry. Since launching Coinsprobe in 2023, he has been providing daily, research-driven insights through in-depth market analysis, on-chain data, and technical research.

Disclaimer: The information on this page may come from third parties and does not represent the views or opinions of Gate. The content displayed on this page is for reference only and does not constitute any financial, investment, or legal advice. Gate does not guarantee the accuracy or completeness of the information and shall not be liable for any losses arising from the use of this information. Virtual asset investments carry high risks and are subject to significant price volatility. You may lose all of your invested principal. Please fully understand the relevant risks and make prudent decisions based on your own financial situation and risk tolerance. For details, please refer to
Disclaimer.
Related Articles
XRP Golden Cross Signals Strength as Price Diverges Below $1.40
XRP exhibits a golden cross on a four-hour chart but faces short-term price declines, with resistance at $1.40 capping gains. Despite weakened trading volume and broader market pressure, strong institutional demand supports its long-term outlook.
CryptoNewsLand17m ago
The Hong Kong Monetary Authority announced the first batch of stablecoin licenses today, with CFX up 7.5% intraday.
Gate News message: On April 10, the Hong Kong Monetary Authority will announce today at 5:00 p.m. the list of the first stablecoin issuer licensees. Driven by expectations of regulatory positives, Conflux (CFX) surged strongly in the short term. According to market data from a certain trading platform, CFX opened today at $0.0518, and the intraday high reached $0.0557. The gain for the day was 7.5%.
GateNews26m ago
Bitcoin Breaks Through $72,000: The Iran–Israel ceasefire boosts risk assets, with $427 million in short positions liquidated, but Polymarket shows disagreement on end-of-year outlook
Bitcoin broke through $72,000 on April 10, mainly due to a fragile ceasefire agreement between the U.S. and Iran that boosted market risk appetite, with funds flowing from safe-haven assets into Bitcoin. Increased institutional inflows and a rebound in Large Investors’ holdings are driving the price higher. Technical analysis shows that the main resistance lies in the $72,200 to $73,500 range. Despite a bullish outlook in the short term, there is still disagreement over forecasts for Bitcoin’s price by year-end, and the risk of a pullback also needs to be watched.
ChainNewsAbmedia1h ago
TAO (Bittensor) down 16.28% over the past 24 hours
Gate News message, on April 10, according to Gate market data, as of the time of publication, TAO (Bittensor) is trading at $269.80, down 16.28% over the past 24 hours. It reached a high of $341.10 and fell to a low of $248.60. The 24-hour trading volume is $14.71 million. The current market cap is approximately $2.59B.
Bittensor is an open-source protocol that supports a decentralized, blockchain-based machine learning network. Machine learning models train collaboratively and earn rewards in TAO based on the value of the information they provide to the collective. TAO also enables external access, allowing users to extract information from the network and adjust network activity according to their own needs.
---
Key recent news about TAO:
1️⃣ **
GateNews2h ago
The Strait of Hormuz is open! Iran demands tolls be paid in Bitcoin, and the Persian Gulf still has “big ships”
The Iranian government charges oil tankers a $1 per-barrel toll for passage through the Strait of Hormuz and requires payment in bitcoin to bypass U.S. sanctions. This move has caused extreme volatility in the cryptocurrency market, with bitcoin’s price surging, highlighting the importance of digital assets in geopolitics. Global shipping has been disrupted, Iran and the United States have taken differing positions in ceasefire talks, and financial markets have also roiled in response to this event.
CryptoCity2h ago
Bitcoin sees over 27k options contracts expire! Analyst: Bear market characteristics continue to dominate
According to Greeks.live data, April 10 saw BTC and ETH options expire. For BTC options, the number of contracts was 27,000, the Put/Call Ratio was 0.71, and the maximum pain point was $69,000. For ETH, it was 151,000 contracts, and the Put/Call Ratio was 0.77. The analysis indicates that market characteristics are skewed bearish, and falling implied volatility suggests the market expects less short-term volatility. Despite the recent rebound, internal momentum in the market has not formed, and no clear sentiment shift has been observed.
MarketWhisper2h ago
