AB (AB) along with a group of privacy coins like Zcash (ZEC) and Monero (XMR) are among the assets that have fallen the most in the past 24 hours, as the crypto market is engulfed in a widespread sell-off.
The downward pressure has not shown signs of easing as both ZEC and XMR have sent clear sell signals, increasing the risk of further decline. Meanwhile, the AB token faces the risk of losing the important psychological support level of 0.00500 USD if the current negative trend continues.
AB approaches important support as selling pressure increases
As of the time of writing on Tuesday, the price of AB has lost nearly 6%, continuing the decline of 7% from the previous session. The recording of the fifth consecutive bearish candle indicates that selling pressure is significantly increasing, pushing the price close to the important psychological support level of 0.005000 USD.
In the event that AB breaks through the 0.005000 USD mark and closes the daily candle decisively below this threshold, the downtrend is likely to extend, bringing the price to test lower support areas at 0.004300 and 0.003800 USD – corresponding to the lows established on 29/5 and 25/5.
 The daily AB/USDT chart | Source: TradingViewThe momentum indicators on the daily timeframe continue to signal negatively. Specifically, the MACD line is widening its slope in the negative region after crossing below the signal line since November 23, reflecting a strengthening downward trend.
At the same time, the RSI index has slid to a level of 32 from the overbought zone established on November 13, indicating that the advantage currently clearly leans towards the sellers.
However, in a more positive scenario, if AB can maintain the level of 0.005000 USD and bounce back, the price could definitely head up to test the 50-day EMA around the 0.006617 USD range.
Zcash faces the risk of a deeper fall
Zcash has lost the $350 mark after a 19% drop in trading on Monday, marking a bleak start to the new week. As of now, the decline shows no signs of stopping as ZEC continues to lose about 3% in Tuesday's session, gradually sliding deeper towards the important psychological support area around $300.
If the 300 USD threshold is breached, the risk of a continued downtrend is very high, with the next target located in the 187 USD range – corresponding to the low established on October 17.
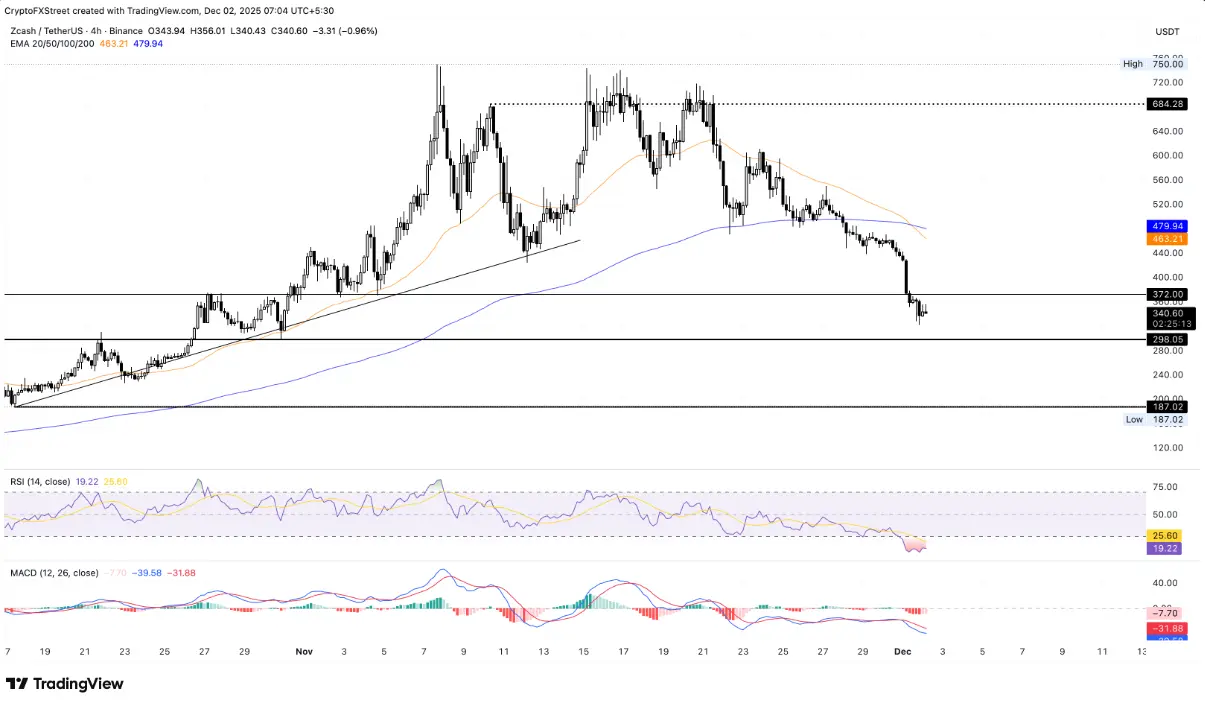 ZEC/USDT chart on the 4-hour frame | Source: TradingViewThe technical indicators are sending clear negative signals. The RSI on the 4-hour time frame has fallen to 19, indicating a severe oversold condition and overwhelming selling pressure. Meanwhile, the MACD line along with the signal line continues to widen the slope in the negative region, reflecting that the downtrend is still prevailing.
Notably, the 50-period EMA just crossed below the 200-period EMA on the 4-hour chart on Monday, forming a “death cross” – one of the strong sell signals, further reinforcing the short-term downtrend.
In a positive scenario, to regain recovery momentum, Zcash needs to quickly surpass the 400 USD mark again. At that point, the upward trend could resume with a target towards the 50-period EMA around the 463 USD area.
Monero may continue to fall after the “bull trap” on Monday
Monero (XMR) continued to fall more than 1% on Tuesday, following a decline of 6% in Monday's session, indicating that selling pressure is intensifying. The negative start to the week erased the 6% gain on Sunday, leaving many investors “trapped” after buying at the price point of 419 USD.
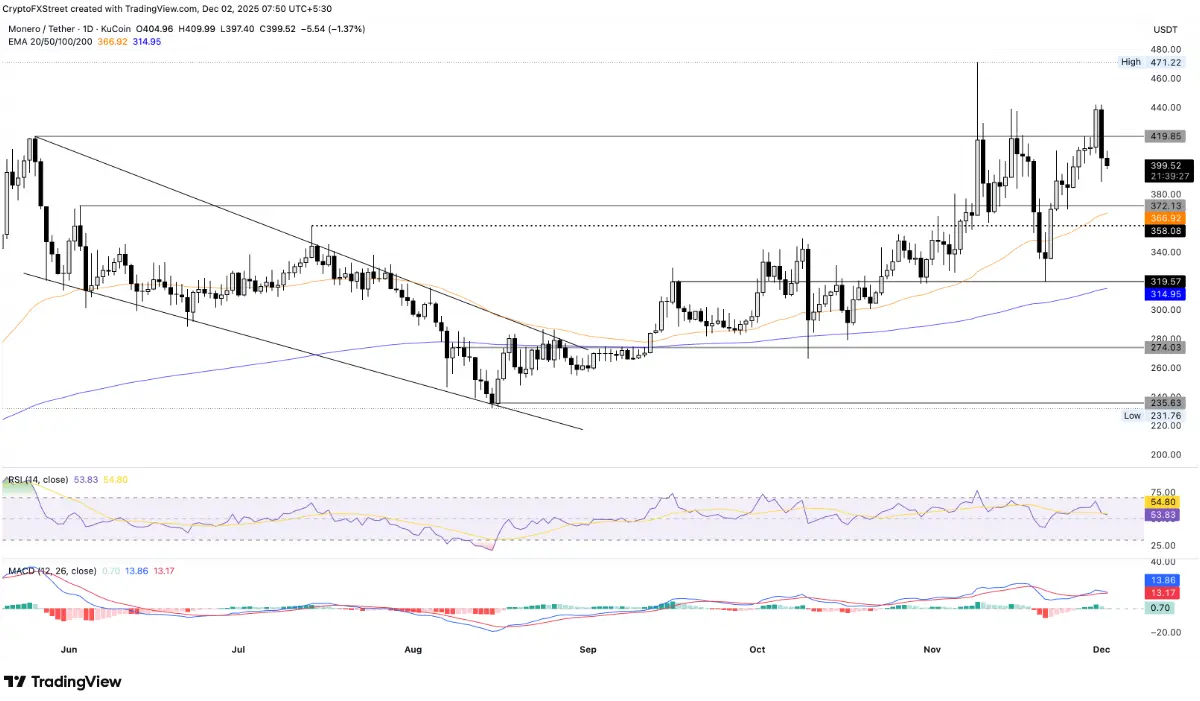 XMR/USDT daily chart | Source: TradingViewAfter forming a “bull trap”, this privacy coin faces the risk of further fall towards the 372 USD zone — coinciding with the old peak established on 3/6. The negative trend is further reinforced as the RSI index is at 53, signaling weakening buying power and the possibility of shifting the advantage to the bears if it drops below the average (50). Meanwhile, the MACD line is converging with the signal line, indicating that the upward momentum is diminishing and the risk of a bearish crossover is emerging, opening up the possibility of continued decline.
On the contrary, for a reversal recovery, XMR needs to break through the threshold of 442 USD — the peak of the previous Sunday.
SN_Nour
Disclaimer: The information on this page may come from third parties and does not represent the views or opinions of Gate. The content displayed on this page is for reference only and does not constitute any financial, investment, or legal advice. Gate does not guarantee the accuracy or completeness of the information and shall not be liable for any losses arising from the use of this information. Virtual asset investments carry high risks and are subject to significant price volatility. You may lose all of your invested principal. Please fully understand the relevant risks and make prudent decisions based on your own financial situation and risk tolerance. For details, please refer to
Disclaimer.
Related Articles
Michael Burry’s warning siren in the crypto market..."A downward spiral of collateral collapse" is coming
Michael Burry’s warning siren in the crypto market..."Collateral liquidation vicious cycle" is coming
SuperCryptoWahaha666666m ago
UNI and AAVE are first in line! Analyst: The current draft crypto market law could severely damage the DeFi yield myth
10x Research warns that if the CLARITY Act is passed, it will ban stablecoin balance yield, potentially impacting DeFi protocols and related tokens. Returns would be funneled back to the traditional financial system, leading to reduced market competition, and many DeFi projects will face strict regulation.
CryptoCity8m ago
XRP Today’s News: Arizona Proposes Legislation to Include XRP as a Treasury Reserve Asset
The Arizona House Rules Committee unanimously passed the SB1649 bill, establishing a Digital Assets Strategic Reserve Fund that puts digital assets such as XRP under the management of the Department of the Treasury, and allows revenue to be generated through methods such as staking. If the bill passes, it will become the first U.S. state to officially recognize XRP as a fiscal reserve asset. XRP is currently trading at $1.28 and faces challenges from technical support and resistance.
MarketWhisper1h ago
Bittensor (TAO) Is Up 140% in 6 Weeks, But Data Shows Retail Is Missing the Big AI Rally
Bittensor has recorded a 140% price increase over the past six weeks, including a 105% rise since March 8.
The latest price action has pushed it to the 26th-largest cryptocurrency by market capitalization, according to new data from Santiment.
AI Tokens Heat Up
-----------------
The rally comes a
CryptoPotato2h ago
Why is Bitcoin down today? Trump’s “Stone Age” comments trigger a $440 million liquidation
Trump, in a speech on April 2, warned Iran, causing market risk sentiment to contract sharply; Bitcoin fell by about 4%, hitting a low of $65,789. Rising oil prices and a strengthening dollar index intensified macro pressure, further impacting the market. From a technical perspective, Bitcoin may face a key support level at $64,000.
MarketWhisper2h ago
Today’s Crypto Fear and Greed Index has fallen to 9, and the market is in extreme fear.
Gate News message, April 3, Alternative.me data shows that today’s Crypto Fear and Greed Index fell to 9, and the market is in an “extreme fear” state. Yesterday, the index was 12, also in an “extreme fear” state.
GateNews3h ago
