Trade
Basic
Futures
Futures
Hundreds of contracts settled in USDT or BTC
TradFi
Gold
Trade global traditional assets with USDT in one place
Options
Hot
Trade European-style vanilla options
Unified Account
Maximize your capital efficiency
Demo Trading
Futures Kickoff
Get prepared for your futures trading
Futures Events
Participate in events to win generous rewards
Demo Trading
Use virtual funds to experience risk-free trading
Earn
Launch
CandyDrop
Collect candies to earn airdrops
Launchpool
Quick staking, earn potential new tokens
HODLer Airdrop
Hold GT and get massive airdrops for free
Launchpad
Be early to the next big token project
Alpha Points
Trade on-chain assets and enjoy airdrop rewards!
Futures Points
Earn futures points and claim airdrop rewards
Investment
Simple Earn
Earn interests with idle tokens
Auto-Invest
Auto-invest on a regular basis
Dual Investment
Buy low and sell high to take profits from price fluctuations
Soft Staking
Earn rewards with flexible staking
Crypto Loan
0 Fees
Pledge one crypto to borrow another
Lending Center
One-stop lending hub
VIP Wealth Hub
Customized wealth management empowers your assets growth
Private Wealth Management
Customized asset management to grow your digital assets
Quant Fund
Top asset management team helps you profit without hassle
Staking
Stake cryptos to earn in PoS products
Smart Leverage
New
No forced liquidation before maturity, worry-free leveraged gains
GUSD Minting
Use USDT/USDC to mint GUSD for treasury-level yields
More
LargeAccountNotes
Remember when you were a kid, with just a few coins in your pocket, squeezing in front of the smoky arcade cabinet.
The sound of inserting coins “clack” — and the whole world was filled with the roar of Metal Slug tanks and the screams of enemies.
No pay-to-win boosts, no microtransactions.
You died because you didn’t remember the tank’s patrol route, because your reaction was 0.2 seconds too slow, because you didn’t time your jump right.
Losing is just losing; drop another coin and try again. No one coddles you, no one guarantees a win.
That feeling… thinking back now, it’s still aw
View OriginalThe sound of inserting coins “clack” — and the whole world was filled with the roar of Metal Slug tanks and the screams of enemies.
No pay-to-win boosts, no microtransactions.
You died because you didn’t remember the tank’s patrol route, because your reaction was 0.2 seconds too slow, because you didn’t time your jump right.
Losing is just losing; drop another coin and try again. No one coddles you, no one guarantees a win.
That feeling… thinking back now, it’s still aw

- Reward
- 2
- Comment
- Repost
- Share
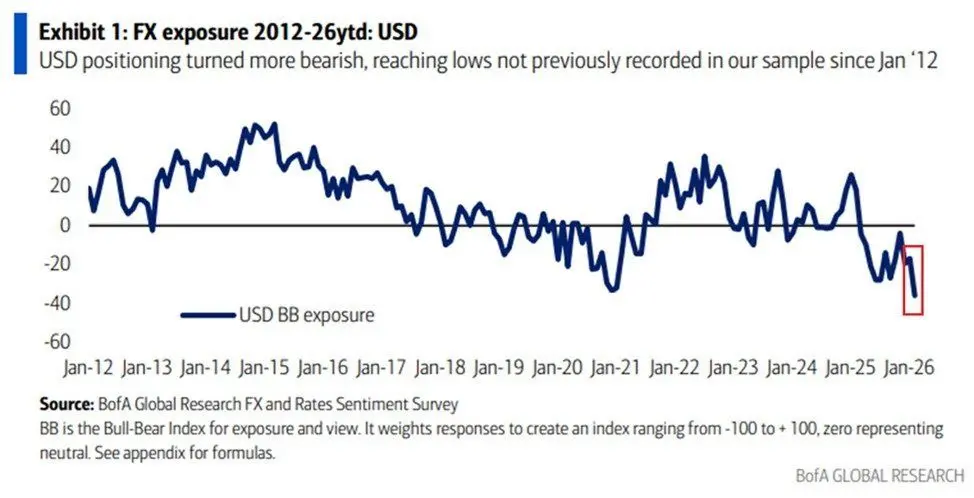
The dollar exposure level has reached -35, the lowest level recorded in at least 14 years.
Additionally, 87% of fund managers expect central banks to continue reducing their holdings of #dollars.
$USD1 $USDC $USDD
#GateSquare$50KRedPacketGiveaway #WhenisBestTimetoEntertheMarket #GateSpringFestivalHorseRacingEvent #CelebratingNewYearOnGateSquare
Additionally, 87% of fund managers expect central banks to continue reducing their holdings of #dollars.
$USD1 $USDC $USDD
#GateSquare$50KRedPacketGiveaway #WhenisBestTimetoEntertheMarket #GateSpringFestivalHorseRacingEvent #CelebratingNewYearOnGateSquare
USD1-0,03%
- Reward
- 2
- Comment
- Repost
- Share
#我在Gate广场过新年
Today marks my 611th consecutive day of posting updates. Not a single day missed. Each post is crafted with care, not rushed. [微笑]If you think I am a serious person, you can follow me, and I hope the daily content can help you. The world is vast, and I am small. Click follow to make it easier to find me. [微笑][微笑]
Grayscale Investments has officially submitted an application to the U.S. SEC, planning to convert its AAVE trust into a spot ETF. This is not only a key step in Grayscale’s product lineup but also a milestone for DeFi’s transition into mainstream finance. It signifies a
AAVE0,49%


- Reward
- 4
- 3
- Repost
- Share
DignifiedFather:
Wishing you great wealth in the Year of the Horse 🐴View More
tc
天才币
Created By@GeniusTraderJieGe
Subscription Progress
0.00%
MC:
$0
More Tokens
#SOLStandsStrong In 2026, Solana continues to establish itself as one of the most resilient and innovative blockchain ecosystems in the crypto space. While many markets experienced volatility and drawdowns throughout the crypto cycle, Solana’s fundamentals have remained strong, supported by network growth, real-world adoption, technical upgrades, and a rapidly expanding DeFi and Web3 ecosystem. Here’s a detailed breakdown of why #SOLStandsStrong is more than just a slogan — it’s a reflection of structural strength.
Solana’s core architecture sets it apart. Built for high throughput and low tra
Solana’s core architecture sets it apart. Built for high throughput and low tra

- Reward
- 4
- 3
- Repost
- Share
SheenCrypto :
:
To The Moon 🌕View More
Join the horse racing predictions, complete tasks to earn horse racing tickets, enjoy daily million Gift Coins giveaways, and share a 100,000 USDT prize pool—all at the Gate 2026 Spring Festival Celebration. https://www.gate.com/competition/year-of-horse-2026?ref_type=165&utm_cmp=7EQB9Jba&ref=BAQVBA9X

- Reward
- 2
- Comment
- Repost
- Share
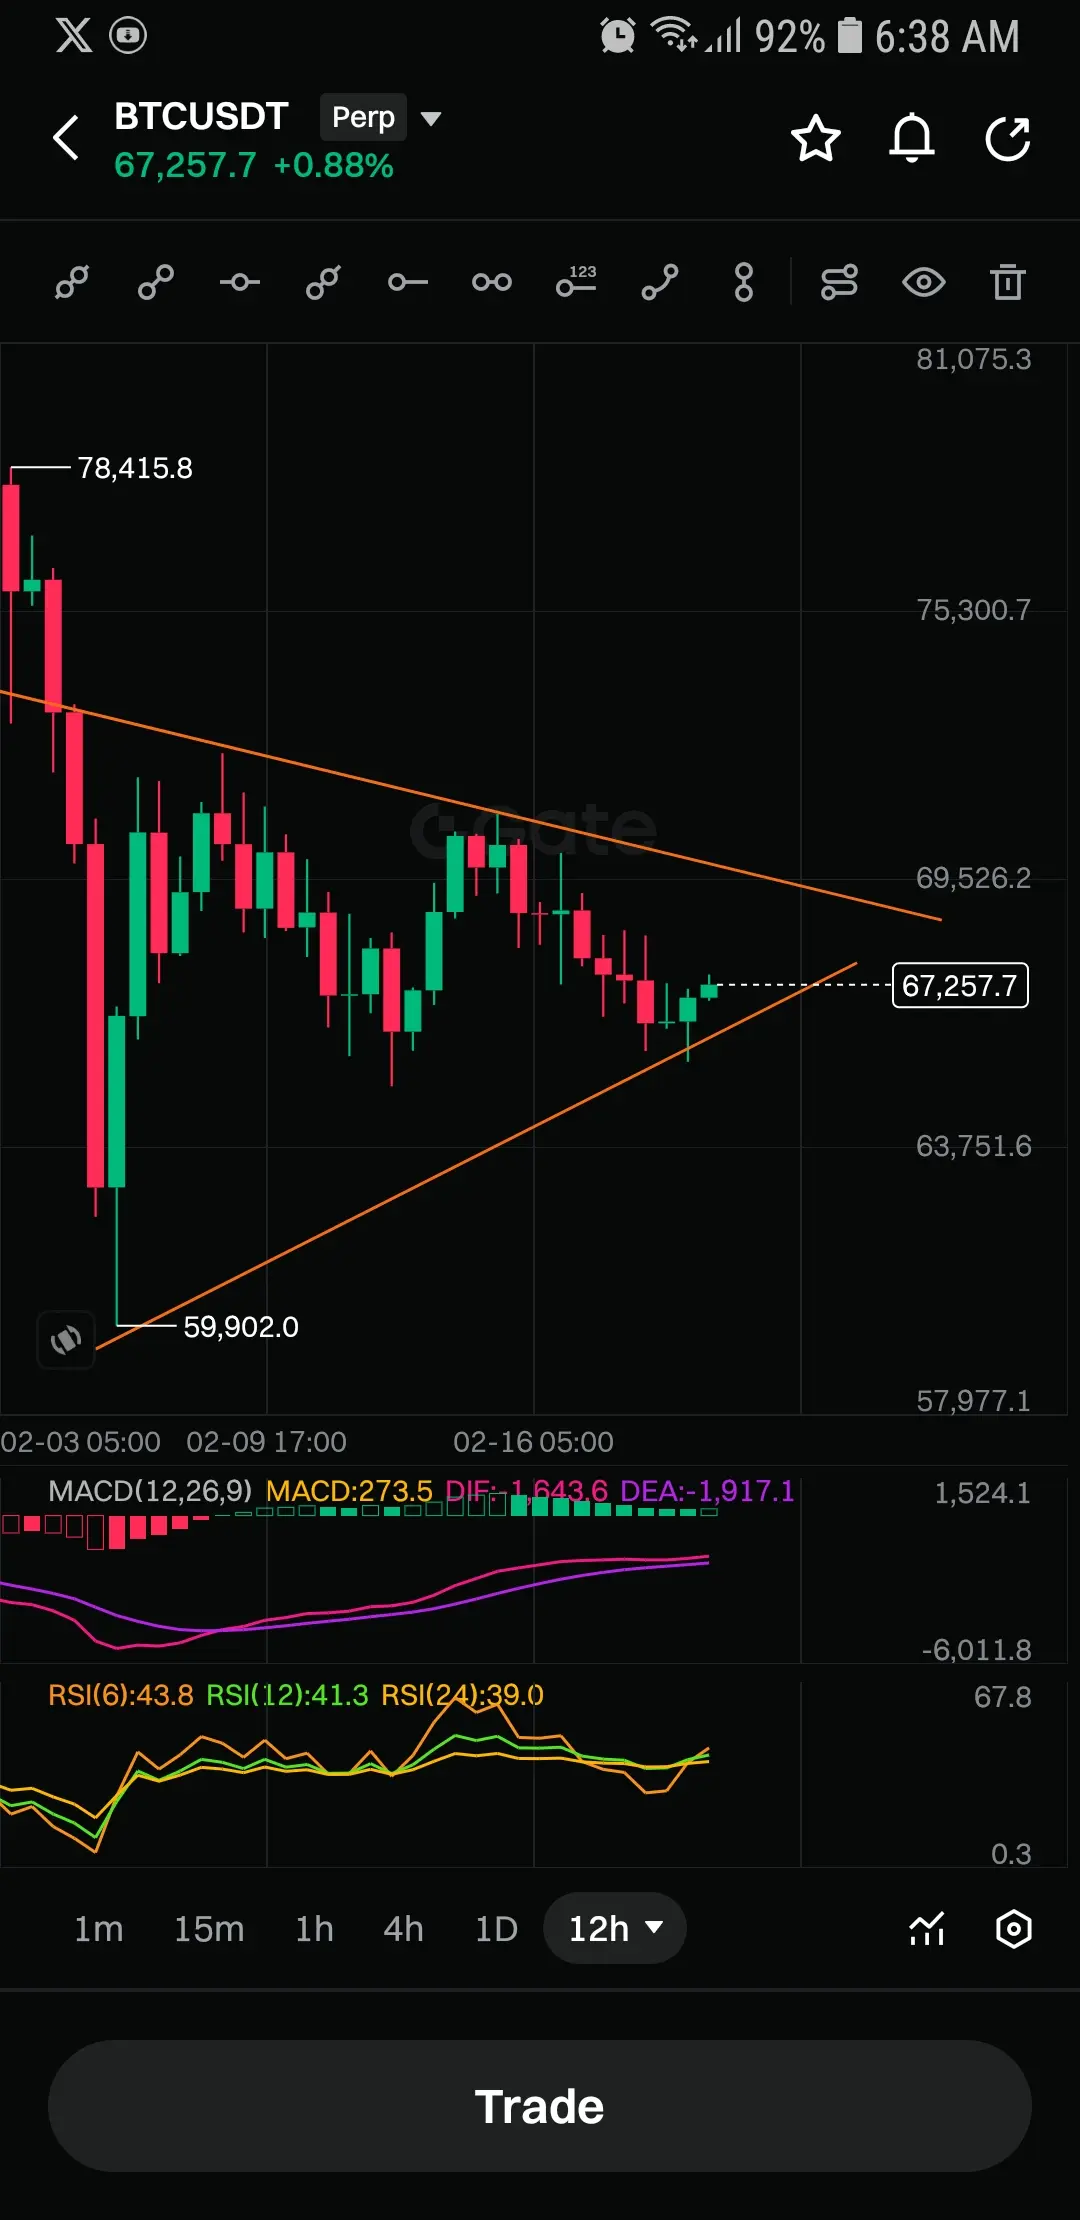
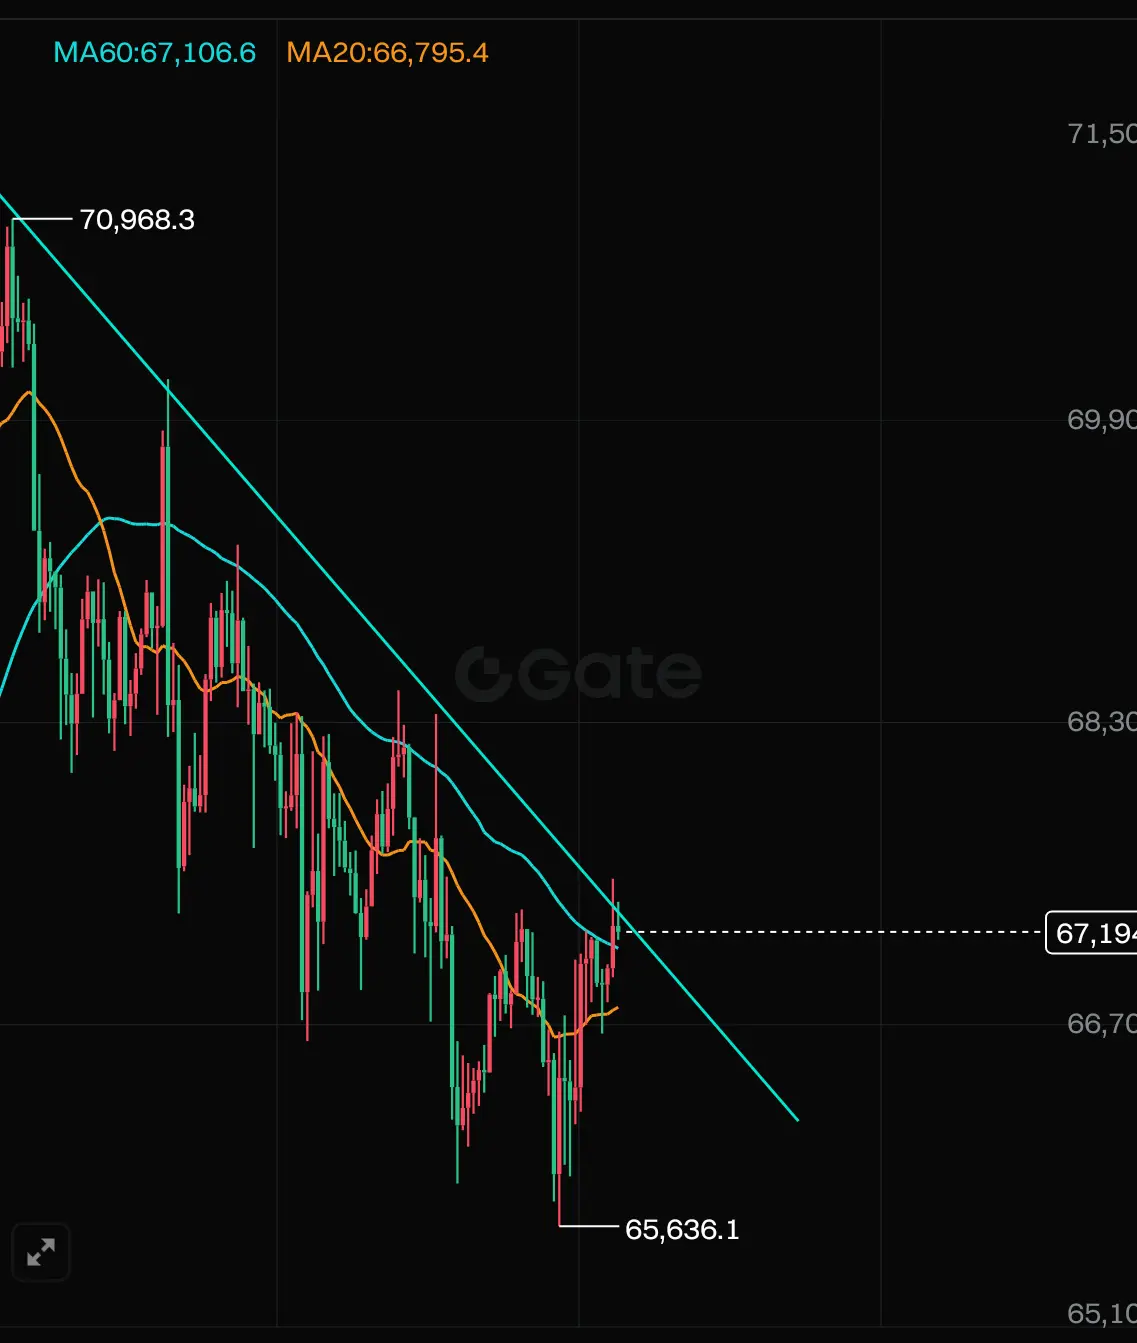
MARKET UPDATE: $BTC $BTC
➖➖➖➖➖➖➖
$BTC is compressing inside a flag structure on the 12H timeframe.
After the strong impulsive move down toward $60K, price has been consolidating between the descending resistance near $70–71K and rising support around $66K.
Currently trading around $66.9K, this compression is reaching its apex. A breakout above $70K would invalidate the bearish flag, while a breakdown below $66K could trigger continuation toward lower levels.
#WhenisBestTimetoEntertheMarket #BTC
BTC0,64%
- Reward
- 2
- Comment
- Repost
- Share
Gate Live 2026 Lunar New Year On-Chain Gala · Non-Stop Market Insights https://www.gate.com/campaigns/3937?ref=VLIWBLOKUW&ref_type=132


- Reward
- 4
- 10
- Repost
- Share
MoonGirl :
:
LFG 🔥View More
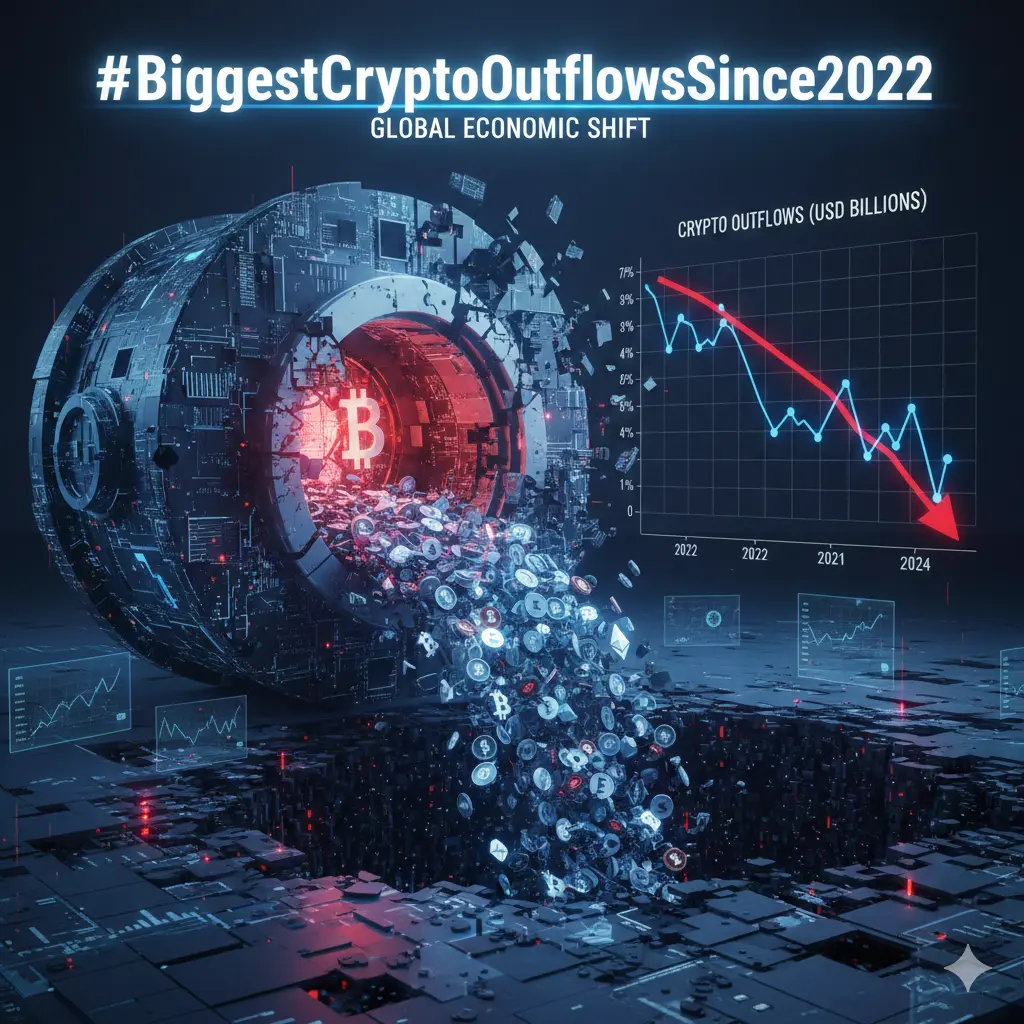
Biggest Crypto Outflows Since 2022 🚨
The crypto market has witnessed some of the largest capital outflows since 2022, signaling a major shift in investor sentiment. Billions have moved out of digital assets as traders react to macroeconomic pressure, regulatory uncertainty, and changing risk appetite.
While short-term confidence may fluctuate, history shows that periods of heavy outflows often reshape the market — filtering weak projects and strengthening long-term fundamentals.
Smart money doesn’t just watch price… it watches flow.
Are we seeing fear — or the setup for the next cycle?
#Bigge
BTC0,64%


- Reward
- 2
- 2
- Repost
- Share
Ryakpanda:
Wishing you great wealth in the Year of the Horse 🐴View More
$UNCX the Unicrypt native token is now available in best price for buying for little amount holders who have just 15-20 USDT in wallet buy this token & hold it tight in future soon it must pump high then sell it don't sell if it price is down in minutes it recover back don't listen any fud just buy and hold.
UNCX0,27%

- Reward
- 2
- Comment
- Repost
- Share
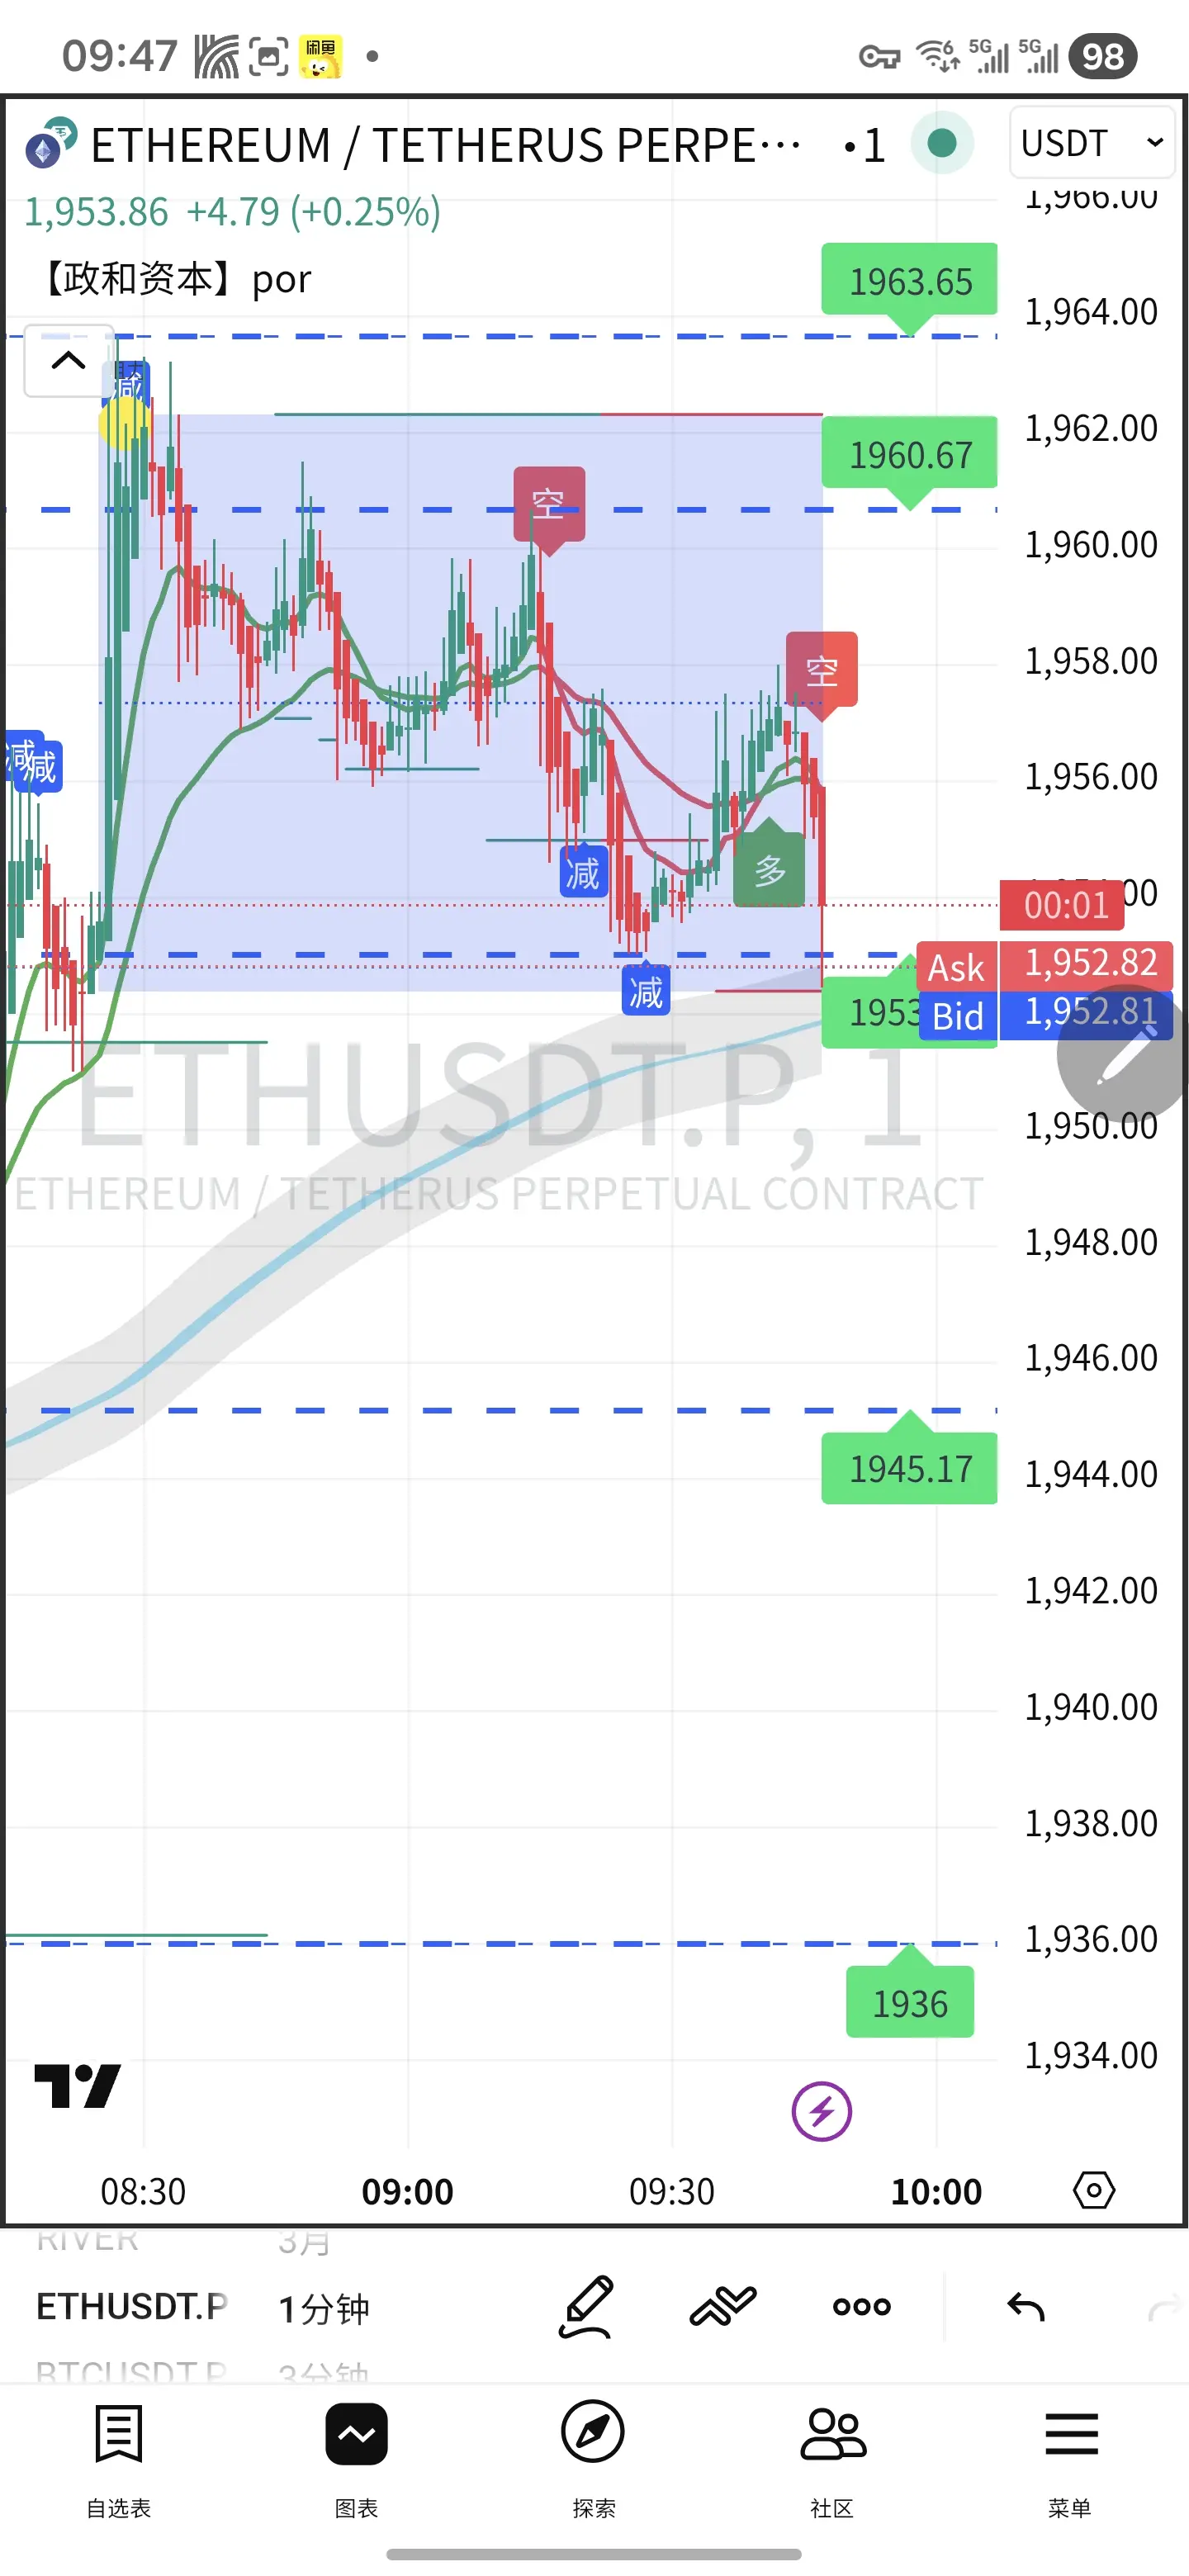
📊 2026-02-20 ETH Technical Analysis (As of this morning)
Current Price: Around $1,950
1. Daily Chart (Mid-term Trend)
- Trend: Mid-term downtrend, price below 50-day moving average (2,200) and 200-day moving average (2,400), overall weak
- RSI: About 27, deeply oversold, accumulation of rebound momentum
- Support/Resistance
- Strong Support: 1,920–1,940 (recent lows + concentrated chips)
- Secondary Support: 1,880 (break below targets 1,840–1,850)
- Resistance: 1,980 → 2,000 → 2,030
2. 4-Hour/Short-term (Intraday Trading)
- Pattern: Low-level oscillation correction, slight rebound a
ETH-0,87%
- Reward
- 3
- Comment
- Repost
- Share
Biggest Crypto Outflows Since 2022 🚨
The crypto market has witnessed some of the largest capital outflows since 2022, signaling a major shift in investor sentiment. Billions have moved out of digital assets as traders react to macroeconomic pressure, regulatory uncertainty, and changing risk appetite.
While short-term confidence may fluctuate, history shows that periods of heavy outflows often reshape the market — filtering weak projects and strengthening long-term fundamentals.
Smart money doesn’t just watch price… it watches flow.
Are we seeing fear — or the setup for the next cycle?
#Bigge
The crypto market has witnessed some of the largest capital outflows since 2022, signaling a major shift in investor sentiment. Billions have moved out of digital assets as traders react to macroeconomic pressure, regulatory uncertainty, and changing risk appetite.
While short-term confidence may fluctuate, history shows that periods of heavy outflows often reshape the market — filtering weak projects and strengthening long-term fundamentals.
Smart money doesn’t just watch price… it watches flow.
Are we seeing fear — or the setup for the next cycle?
#Bigge
BTC0,64%
- Reward
- 3
- 2
- Repost
- Share
FixedBetBtc :
:
Happy New Year 🧨View More
Live Trading and Learning with Chillzzz
1
- Reward
- like
- Comment
- Repost
- Share
btc1
btc1
Created By@GateUser-a5f9198b
Listing Progress
0.00%
MC:
$0.1
More Tokens
#CelebratingNewYearOnGateSquare
New Year, New Excitement, and Amazing Rewards with Gate.io! 🚀
The year 2026 has risen with new hopes! The Gate Square community is celebrating this year with renewed enthusiasm and excitement. If you haven't joined this celebration yet, believe me, you're missing out on big prizes! 🎁
🌟 Why Celebrate the New Year on Gate Square?
Gate.io is not just an exchange, it's a lifestyle! This New Year, we bring you some special gifts:
🧧 Exclusive Red Packets: In the joy of the New Year, special Red Packets are being distributed every now and then.
🤝 Global Community:
View OriginalNew Year, New Excitement, and Amazing Rewards with Gate.io! 🚀
The year 2026 has risen with new hopes! The Gate Square community is celebrating this year with renewed enthusiasm and excitement. If you haven't joined this celebration yet, believe me, you're missing out on big prizes! 🎁
🌟 Why Celebrate the New Year on Gate Square?
Gate.io is not just an exchange, it's a lifestyle! This New Year, we bring you some special gifts:
🧧 Exclusive Red Packets: In the joy of the New Year, special Red Packets are being distributed every now and then.
🤝 Global Community:


- Reward
- 5
- 6
- Repost
- Share
MoonGirl:
To The Moon 🌕View More
Gate Square Creator Certification Incentive Program Is Recruiting!
Join Gate Square and create to share over $10,000 in monthly rewards!
Token prize pools, exclusive Gate merch, promotion opportunities, and massive traffic exposure await! 🚀
Both Gate certified creators and high-quality creators from other platforms are welcome to apply!
Apply now 👉 https://www.gate.com/questionnaire/7159
📅 Starting from Nov 1, 2025, ongoing every month.
Let your great content shine and grow together with our creator community!
📘 More details: https://www.gate.com/announcements/article/47889
Details about

- Reward
- 3
- 5
- Repost
- Share
Ryakpanda:
Wishing you great wealth in the Year of the Horse 🐴View More
HOW ABOUT WE ALL GET OUR SHIT TOGETHER AND BEHAVE LIKE NORMAL PEOPLE? DO YOU REALLY WANT OUR WORLD GOING TO SHIT?
- Reward
- like
- Comment
- Repost
- Share
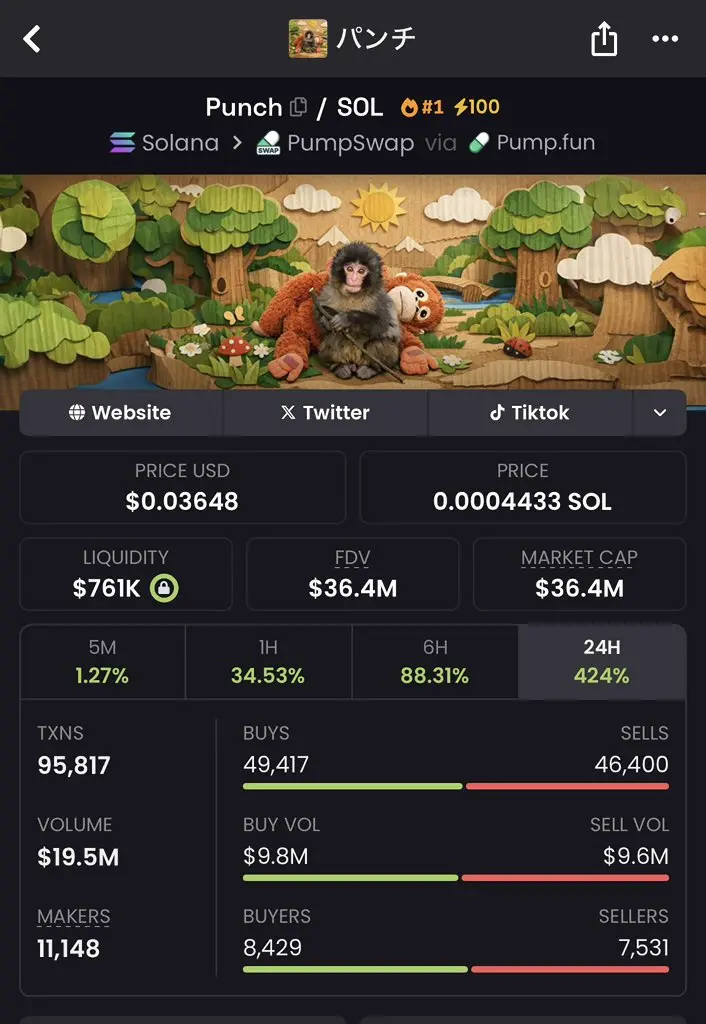
I begged u to buy #BUTTCOIN - it did 1800x
I begged u to buy #TRUMP - it did 236x
I begged u to buy $PUNCH - it did 700x
I begged u to buy #WHITEWHALE - it did 2500x
This time i’m calling another coin launching soon - Buy at low MC = 1000x
I Will send the CA to those who like, retweet, and comment 'ME'
[Must follow + open DM]
I begged u to buy #TRUMP - it did 236x
I begged u to buy $PUNCH - it did 700x
I begged u to buy #WHITEWHALE - it did 2500x
This time i’m calling another coin launching soon - Buy at low MC = 1000x
I Will send the CA to those who like, retweet, and comment 'ME'
[Must follow + open DM]
TRUMP1,25%
- Reward
- 2
- Comment
- Repost
- Share
I'm just taking a neutral position here, with the reason being that the trend is bearish, based on the rebound trend line resistance during the decline, which is logical and well-founded.
Anyway, my feeling is that stop-losses don't really count as losses. If you're hit and it’s justified, it's not a technical issue—it's clearly resistance. If it doesn't hold, then whose problem is it? Could it be customer service?
View OriginalAnyway, my feeling is that stop-losses don't really count as losses. If you're hit and it’s justified, it's not a technical issue—it's clearly resistance. If it doesn't hold, then whose problem is it? Could it be customer service?
- Reward
- 2
- Comment
- Repost
- Share
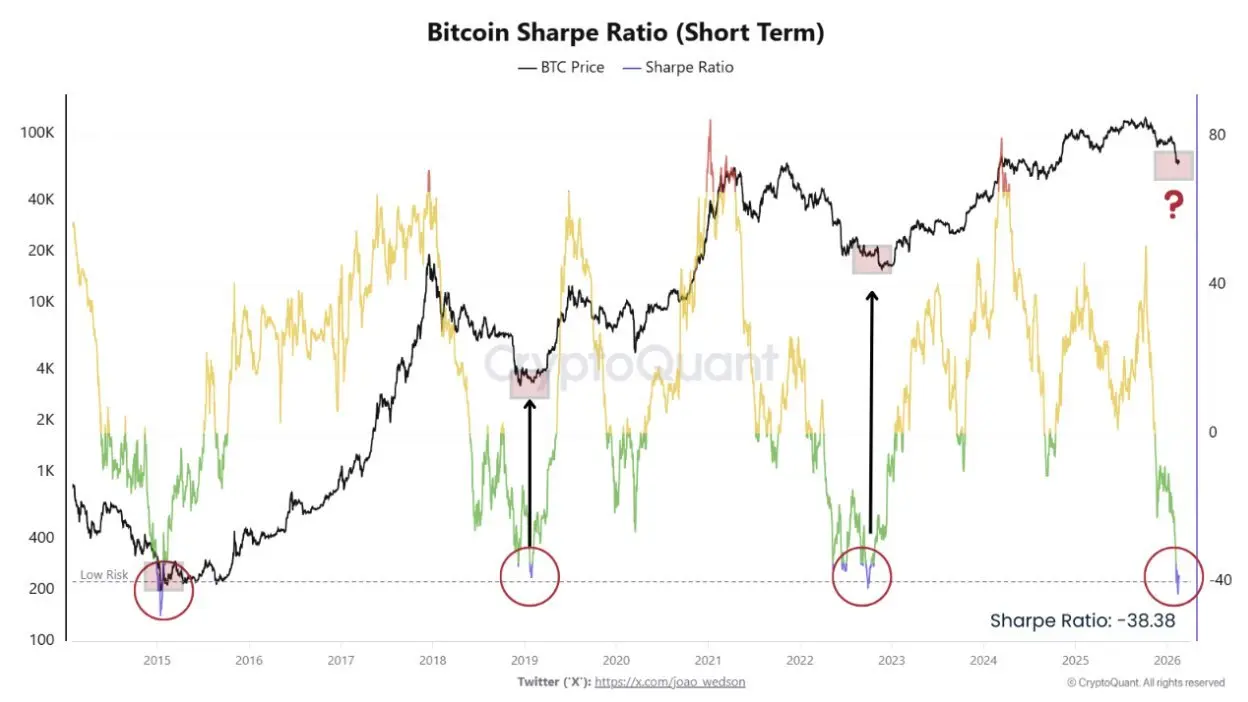
$BTC
Bitcoin has reached a historic level designated for buying zones.
I gave you a buy entry at the best number two weeks ago, and up to this moment, it hasn't broken.
#Bitcoin
$BTC
#GateSquare$50KRedPacketGiveaway #WhenisBestTimetoEntertheMarket #GateSpringFestivalHorseRacingEvent #CelebratingNewYearOnGateSquare
BTC0,64%
- Reward
- 2
- Comment
- Repost
- Share
Mo Yan said: "I burn all my naivety and willfulness with persistence, and that wilderness gradually grows into reason, indifference, and clarity."
One day, you'll realize that in the end, all relationships are just acquaintances.
Everyone is a temporary companion.
Those people you once thought about day and night,
and the questions that never had answers,
in the end, time will casually brush them aside for you.
View OriginalOne day, you'll realize that in the end, all relationships are just acquaintances.
Everyone is a temporary companion.
Those people you once thought about day and night,
and the questions that never had answers,
in the end, time will casually brush them aside for you.

- Reward
- 2
- Comment
- Repost
- Share
Participate in horse racing betting, complete tasks to earn horse racing tickets, and enjoy a million red envelope rain daily, sharing a prize pool of 100,000 USDT at the Gate 2026 Spring Festival Celebration. https://www.gate.com/competition/year-of-horse-2026?ref_type=165&utm_cmp=7EQB9Jba&ref=BTCZSYET
View Original
- Reward
- 2
- Comment
- Repost
- Share
Load More
Join 40M users in our growing community
⚡️ Join 40M users in the crypto craze discussion
💬 Engage with your favorite top creators
👍 See what interests you
Trending Topics
View More242.83K Popularity
869.15K Popularity
10.63M Popularity
97.94K Popularity
512.9K Popularity
Hot Gate Fun
View More- MC:$2.44KHolders:10.00%
- MC:$2.44KHolders:10.00%
- MC:$2.44KHolders:10.00%
- MC:$2.43KHolders:00.00%
- MC:$0.1Holders:10.00%
News
View MoreDragonfly Partner: Smart contracts are difficult to replace legal agreements, and cryptocurrencies are more designed for machines rather than humans
1 m
Data: USDC trading volume surged 20 times within 18 months, with Polygon and Base handling a total of 68% of USDC transactions.
3 m
Sharplink Ethereum holdings increase to 867,000 coins, valued at approximately $1.68 billion, with institutional investors' share rising to 46%
11 m
Data: Hyperliquid platform whales currently hold positions worth $3.01 billion, with a long-short position ratio of 1.
14 m
Market Report: Top 5 Cryptocurrency Gainers on February 20, 2026, led by Kite
15 m
Pin