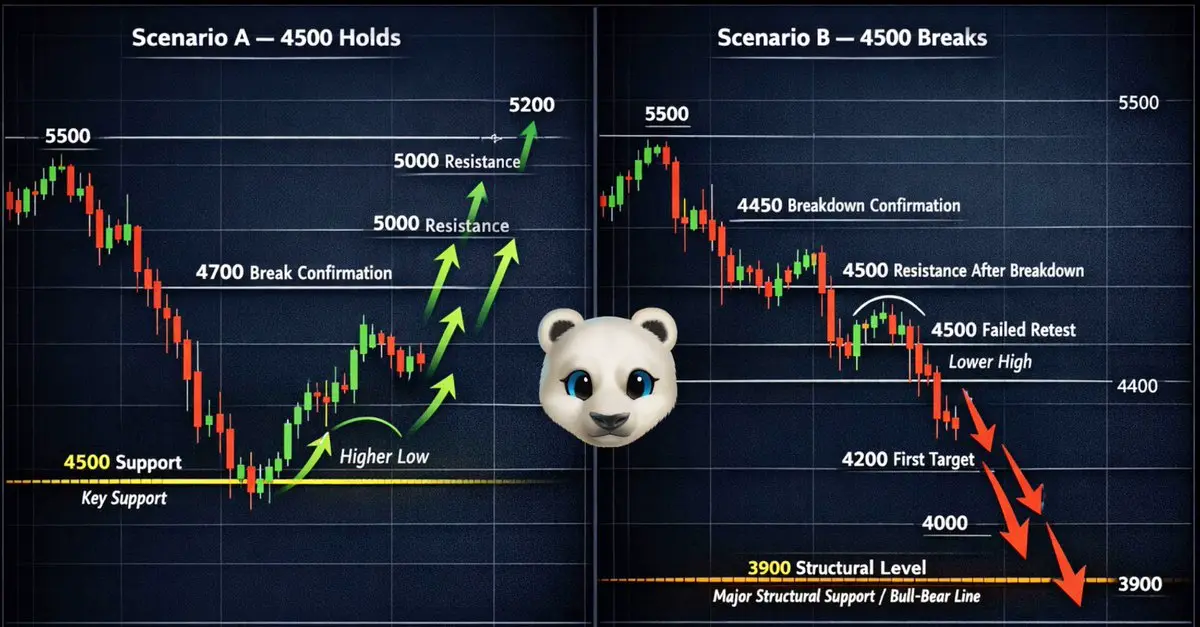
$XAU $XAUT 🟢LEFT PANEL TITLE: "Scenario A – 4500 Holds"
Show price dropping from 5500 to 4500.
Mark 4500 as "Key Support" with a highlighted horizontal line.
From 4500, show a bounce forming a Higher Low structure.
Mark 4700 as "Momentum Pivot".
Show consolidation above 4700.
Draw projected upward wave arrows toward 4800, 5000, and 5200.
Label key turning points: 4500 Support, 4700 Break Confirmation, 5000 Resistance, 5200 Extension.
🔴RIGHT PANEL TITLE: "Scenario B – 4500 Breaks"
Show price dropping from 5500 to 4500.
Then clearly break below 4500.
Mark 4500 as "Resistance After Breakdown".