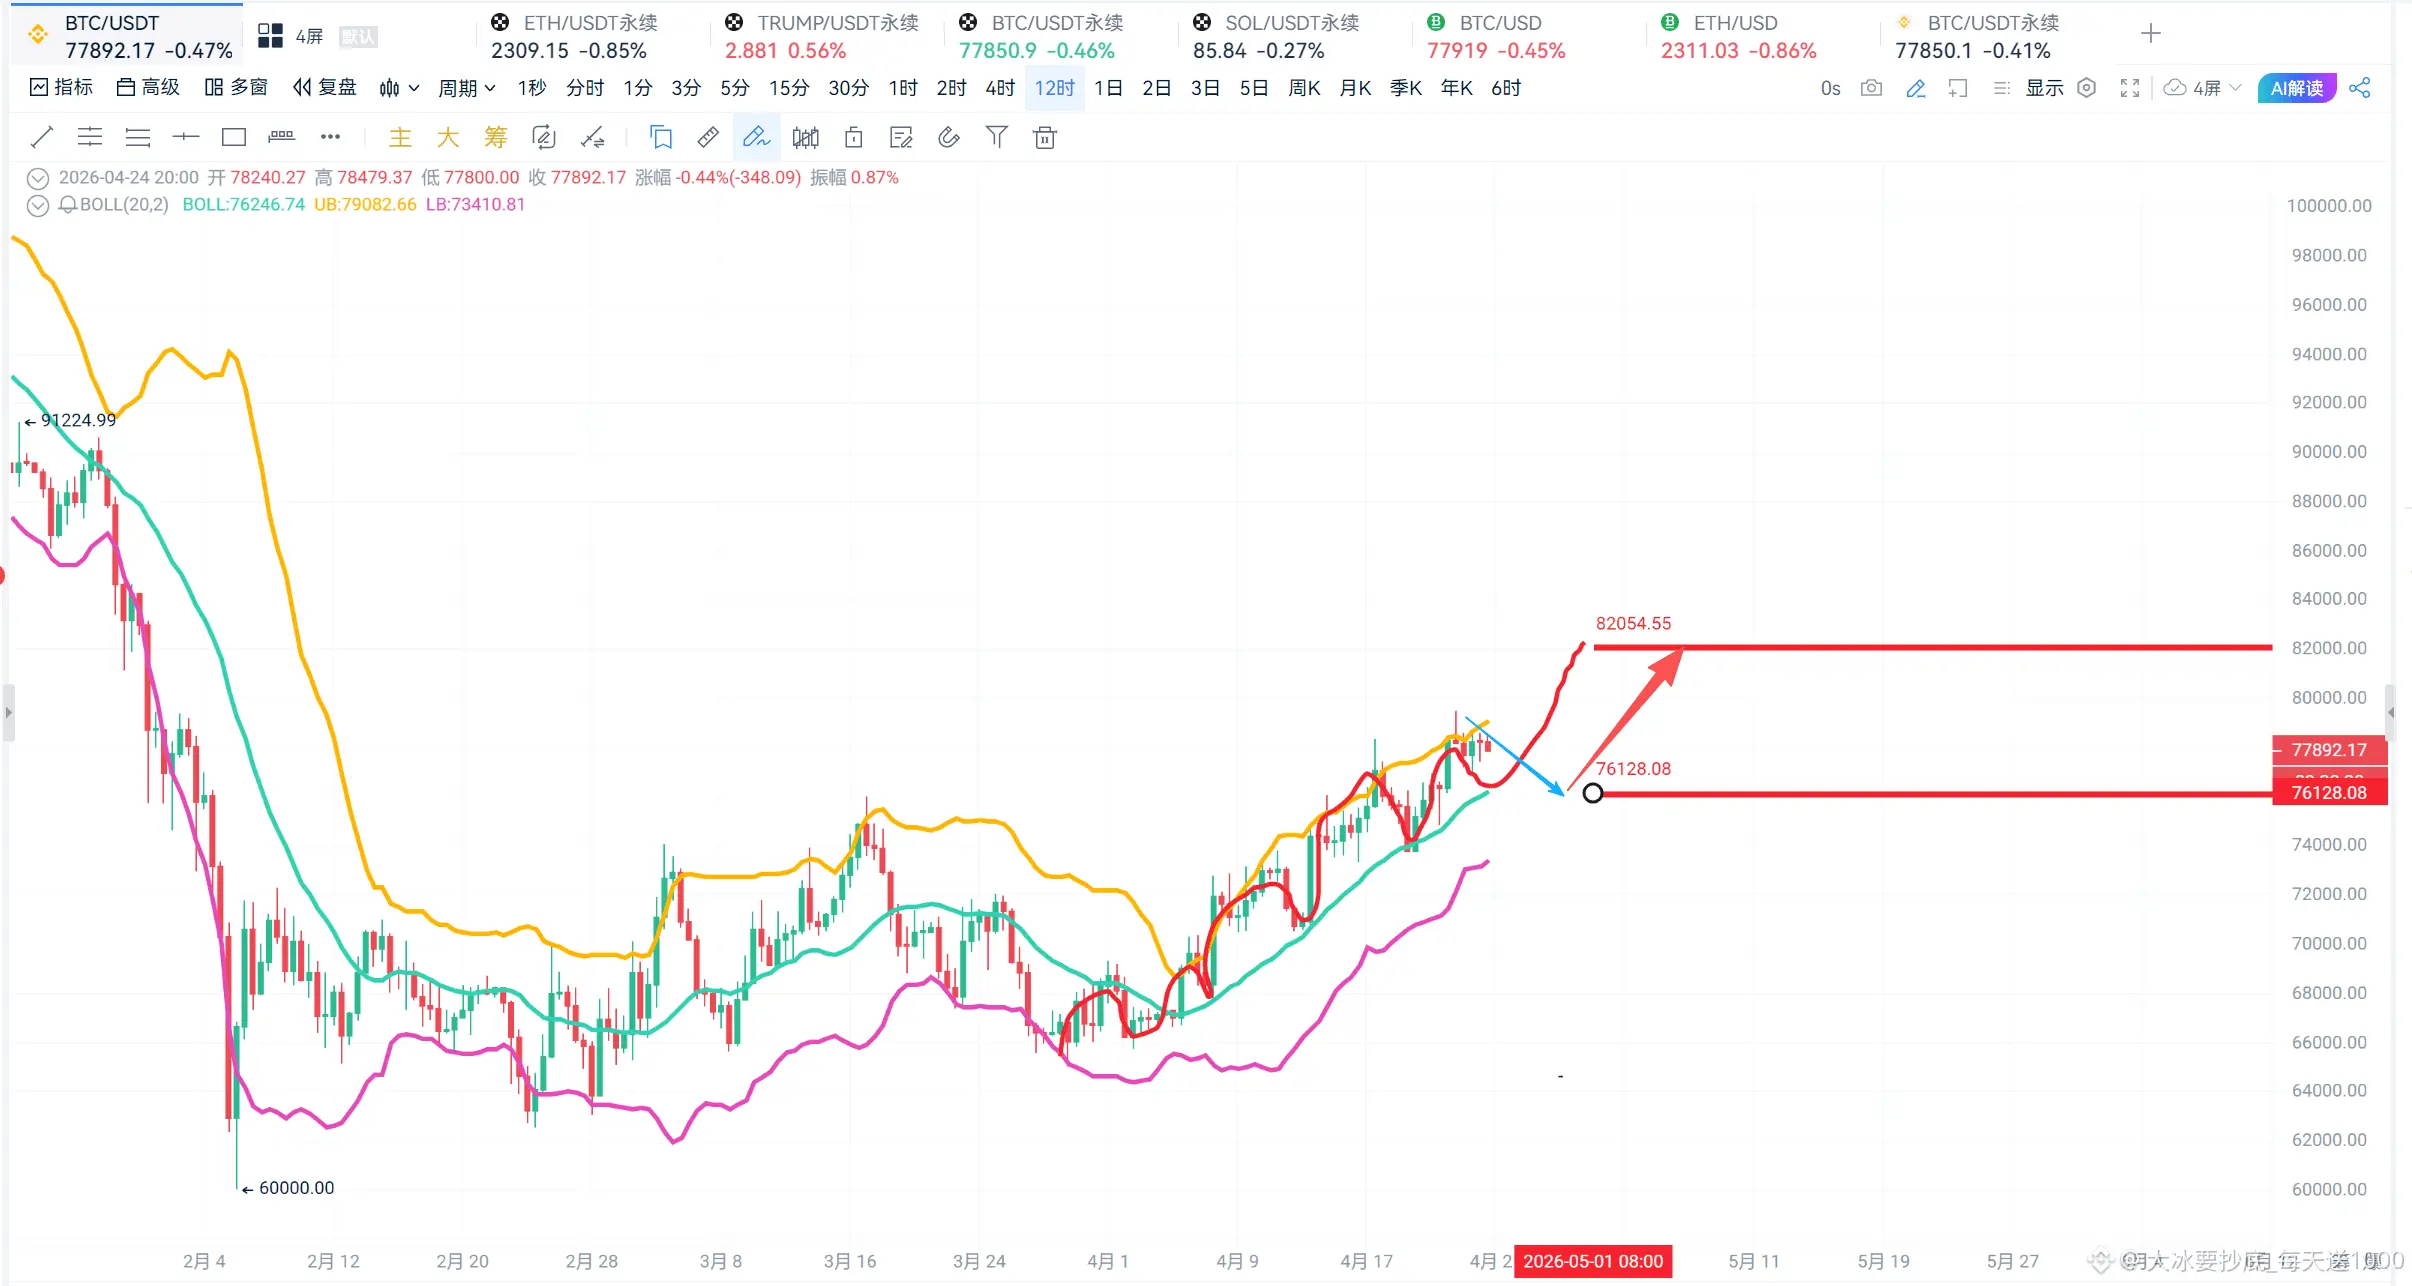
It's the end of April, and I drew the latest Bitcoin candlestick chart.
Bitcoin BTC has been rallying from 65,000 to 79,000 over the past month, with a pattern of dropping 3,000 dollars every time it rises 5,000 dollars—this trend is like small steps upward.
So, after the recent 79,500, Bitcoin has started a small correction again, from 79,500 to 76,500 = 3,000.
If it's a normal correction like 79,500 to 76,000 = 3,500 dollars, don't be afraid or panicked.
76,000 plus—this is also a good position for the big ice's long entry, a solid upward trend. Don't be afraid or panicked.
After t
View Original