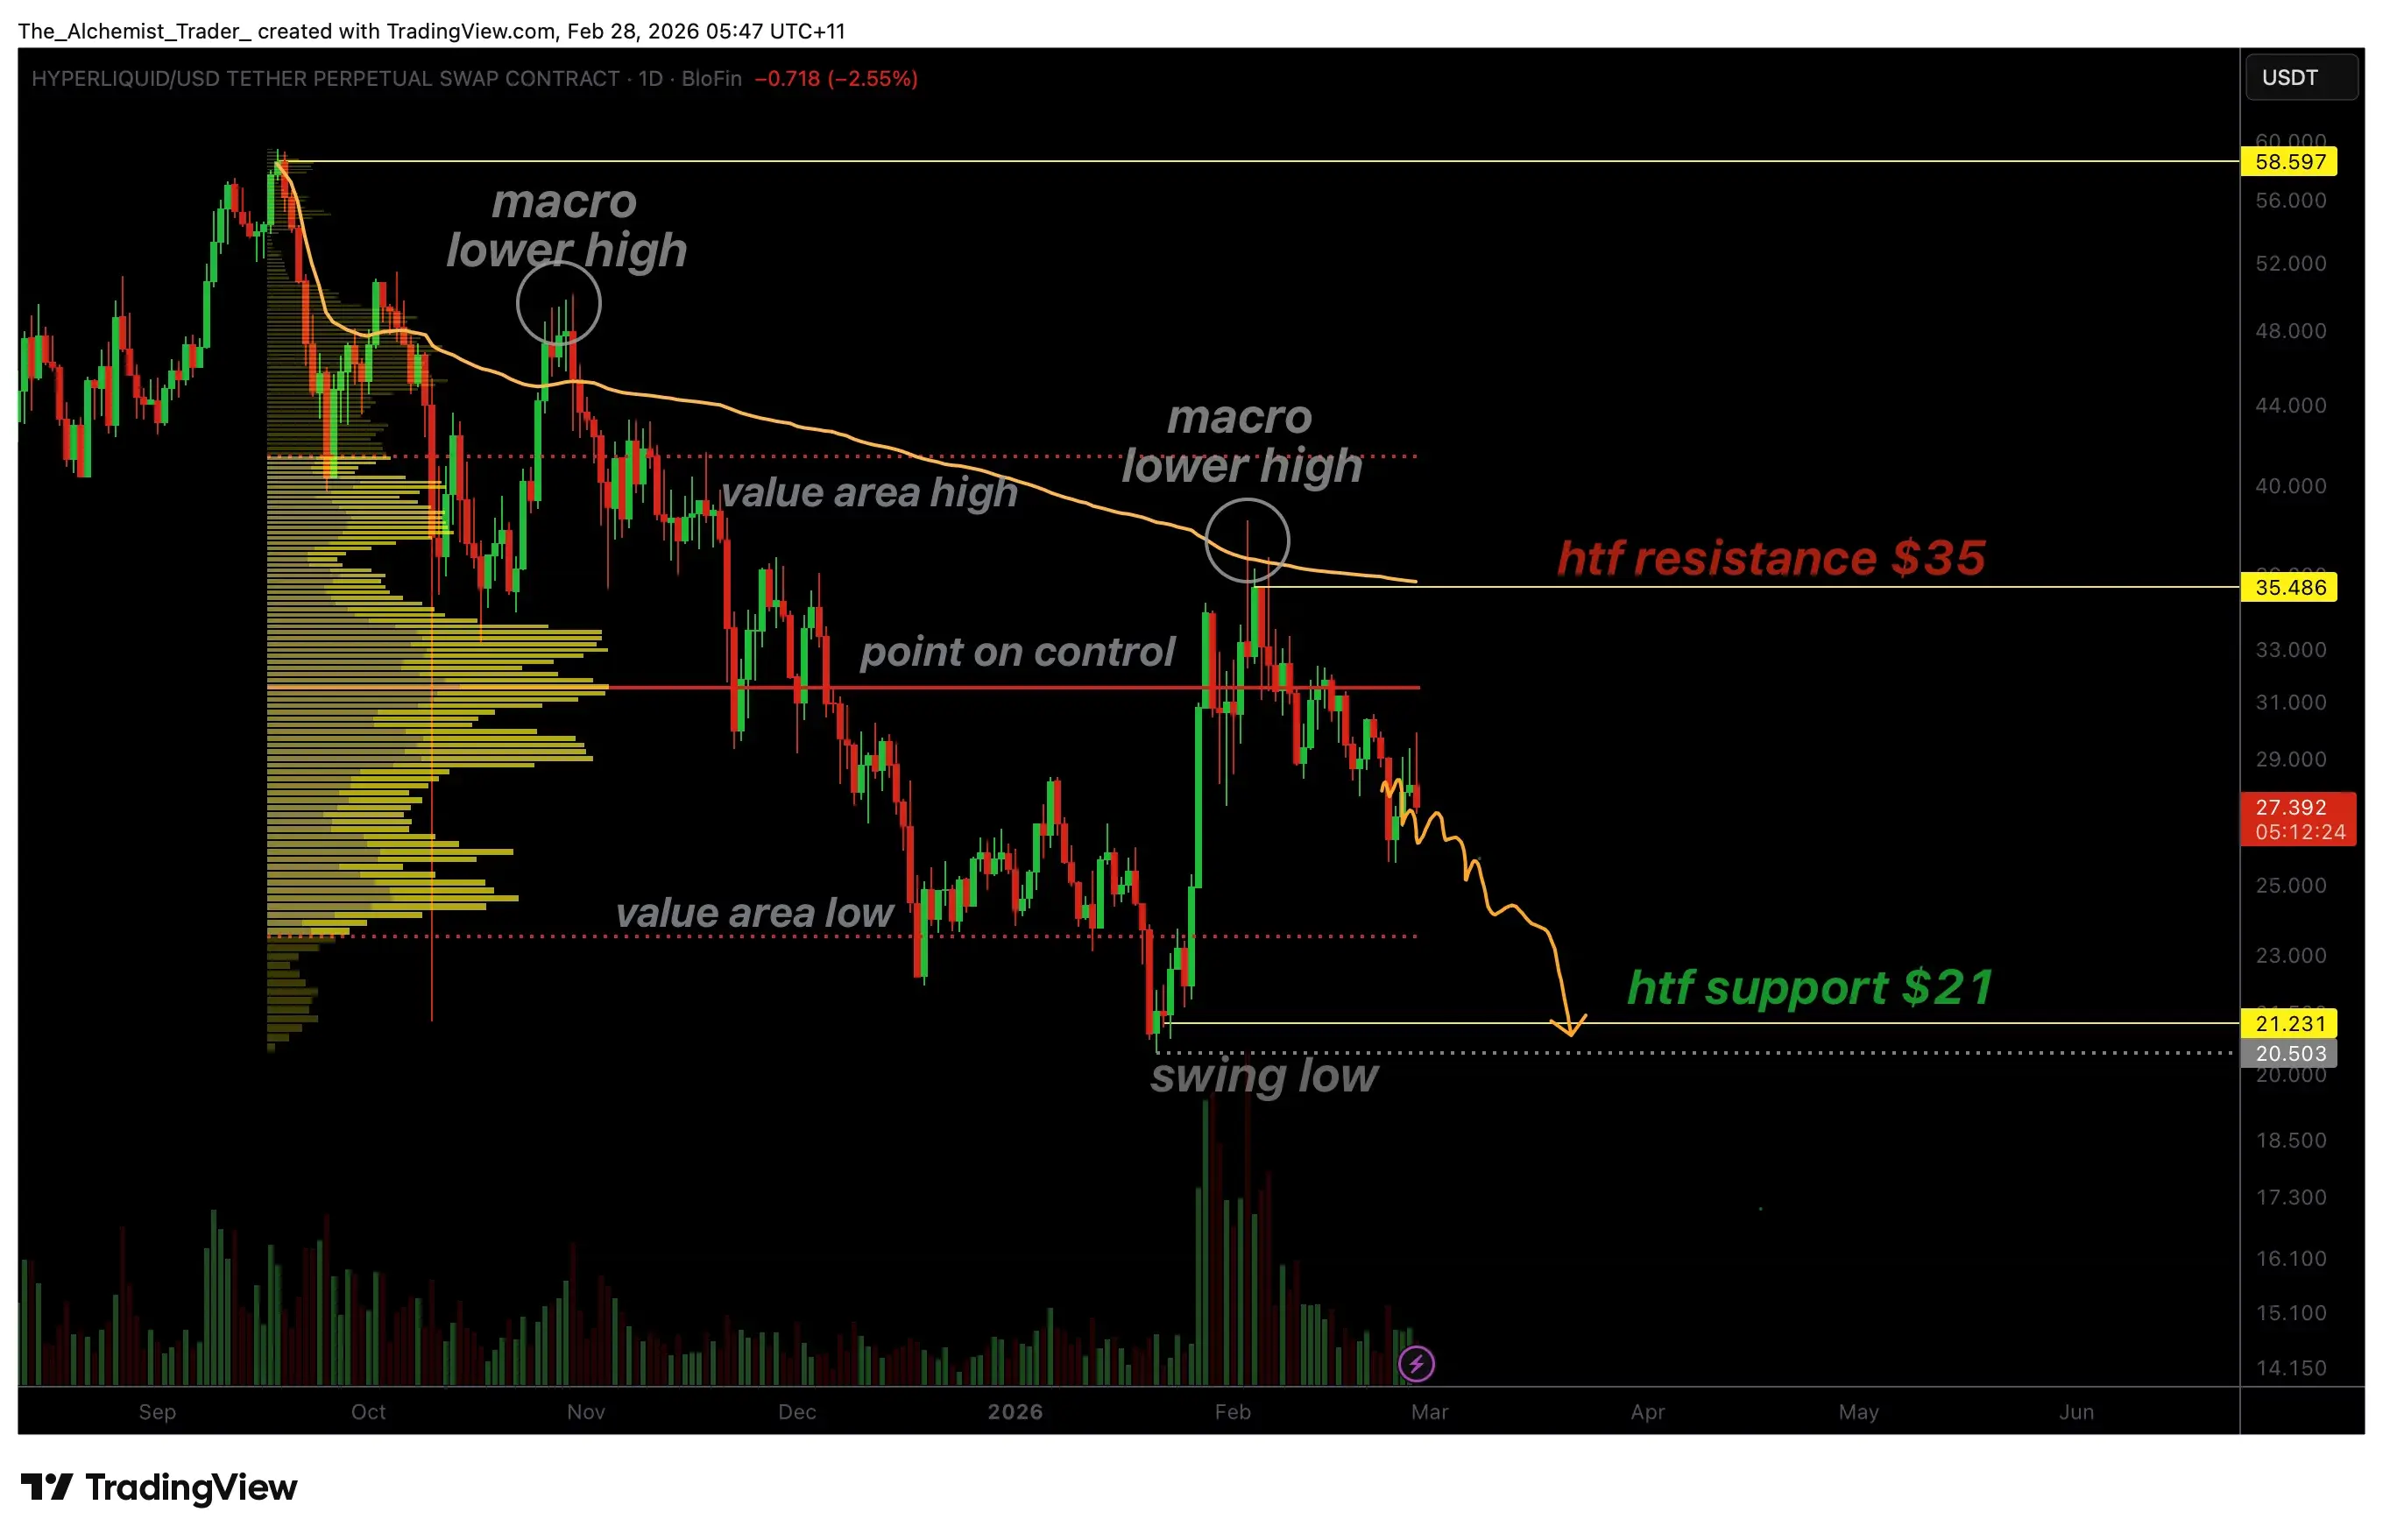
February 28 News: Hyperliquid’s price faces resistance at high levels again, forming a macro “lower high” structure, with ongoing correction pressure increasing. After failing to regain a key volume zone, technical indicators point to the next significant support area around $22.
From a higher time frame, Hyperliquid remains in a clear bearish structure. The price has rebounded multiple times but continues to make lower highs, with no substantial trend reversal. Recent rebounds around $35 encountered resistance at this level, which coincides with the volume-weighted average price (VWAP) and the high point of the value area, forming a strong resonance resistance zone. The price pulled back under pressure, indicating sellers still hold the dominant position.
After being blocked, the market retreated to the Point of Control (POC). The POC represents the most traded price area within the current range, often serving as a key dividing line between bulls and bears. However, Hyperliquid failed to stabilize above the POC and instead broke below this volume support, suggesting insufficient demand and increasing likelihood of trend continuation.
Following the loss of POC support, the market entered a new correction phase. Technical structure shows that if the price continues to trade below the POC and faces resistance at higher cycle levels, liquidity may shift down to the $22–$21 range. This zone is not only a previous swing low but also a potential phase panic release area, regarded as an important medium- to long-term demand test zone.
 (Source: TradingView)
For investors monitoring Hyperliquid’s price trend, whether $22 can form an effective support will be a key point in judging whether the trend will further deteriorate. A volume-supported rebound in this area could create conditions for subsequent structural recovery; if it fails to hold, deeper correction risks should be watched. Under the current technical landscape, the market remains cautious.
(Source: TradingView)
For investors monitoring Hyperliquid’s price trend, whether $22 can form an effective support will be a key point in judging whether the trend will further deteriorate. A volume-supported rebound in this area could create conditions for subsequent structural recovery; if it fails to hold, deeper correction risks should be watched. Under the current technical landscape, the market remains cautious.
Disclaimer: The information on this page may come from third parties and does not represent the views or opinions of Gate. The content displayed on this page is for reference only and does not constitute any financial, investment, or legal advice. Gate does not guarantee the accuracy or completeness of the information and shall not be liable for any losses arising from the use of this information. Virtual asset investments carry high risks and are subject to significant price volatility. You may lose all of your invested principal. Please fully understand the relevant risks and make prudent decisions based on your own financial situation and risk tolerance. For details, please refer to
Disclaimer.
Related Articles
Zcash Could Slide to $120 if Key Support Does Not Hold
Support Risk: ZEC trades between $225 and $205; a break could push price toward $120.
Technical Indicators: MFI at 18 and RSI below 50 signal continued bearish momentum.
Short-Term Moves: Liquidity clusters may allow minor rebounds, but downside risk remains high.
Zcash — ZEC, has
CryptoNewsLand6m ago
Bitwise Backtesting: The probability of Bitcoin holding for 3 years resulting in a loss is only 0.7%, short-term trading carries high risk
According to Bitwise's historical data analysis, the probability of holding Bitcoin for more than three years resulting in a loss is only 0.7%, and zero for ten years. In contrast, the loss risk for short-term trading is as high as 47%. The data shows that long-term holding can effectively reduce the risk of losses, emphasizing the importance of time in investing. Investors should focus on holding duration rather than short-term fluctuations.
動區BlockTempo31m ago
Here’s Where XRP Price Could Be Headed This New Week
XRP shows cautious optimism with Ripple's CTO clarifying transaction independence on the XRP Ledger amidst regulatory scrutiny. Despite good news, XRP's price remains stable around $1.39–$1.40, with consolidation observed. Potential price targets are identified, emphasizing the need for direction in the market.
CaptainAltcoin47m ago
Bitcoin becomes a get-out-of-jail-free card? Middle East conflict intensifies, BTC rebounds to 68K
The United States and Israel launched a military attack on Iran, triggering tensions in the Middle East and resulting in 200 casualties. Bitcoin, due to the market being closed, has become a liquidity indicator, with prices rebounding from 63K to 68K, indicating increased demand for safe-haven assets. Traditional financial regulatory risks are driving more people toward cryptocurrencies.
ChainNewsAbmedia1h ago
The Bitcoin bottom fractal pattern signals a 130% increase, but will it still be valid in 2026?
The Bitcoin bottom formation signal that appeared in 2023—just before the 130% surge in 2024—has re-emerged this week, raising the possibility that the price is approaching a new bullish reversal point. However, the current context of liquidity, ETF capital flows, and macroeconomic data has changed significantly.
TapChiBitcoin2h ago
Bitcoin Derivatives Market Undergoes Panic Selling Amid Escalating Geopolitical Tensions
The Bitcoin ($BTC) market is experiencing a significant downturn due to panic selling amid rising U.S.-Iran tensions, leading to $1.8B in derivatives sell volume within an hour. This has caused a sharp decline in trader confidence and Bitcoin's price, now around $60K.
BlockChainReporter2h ago