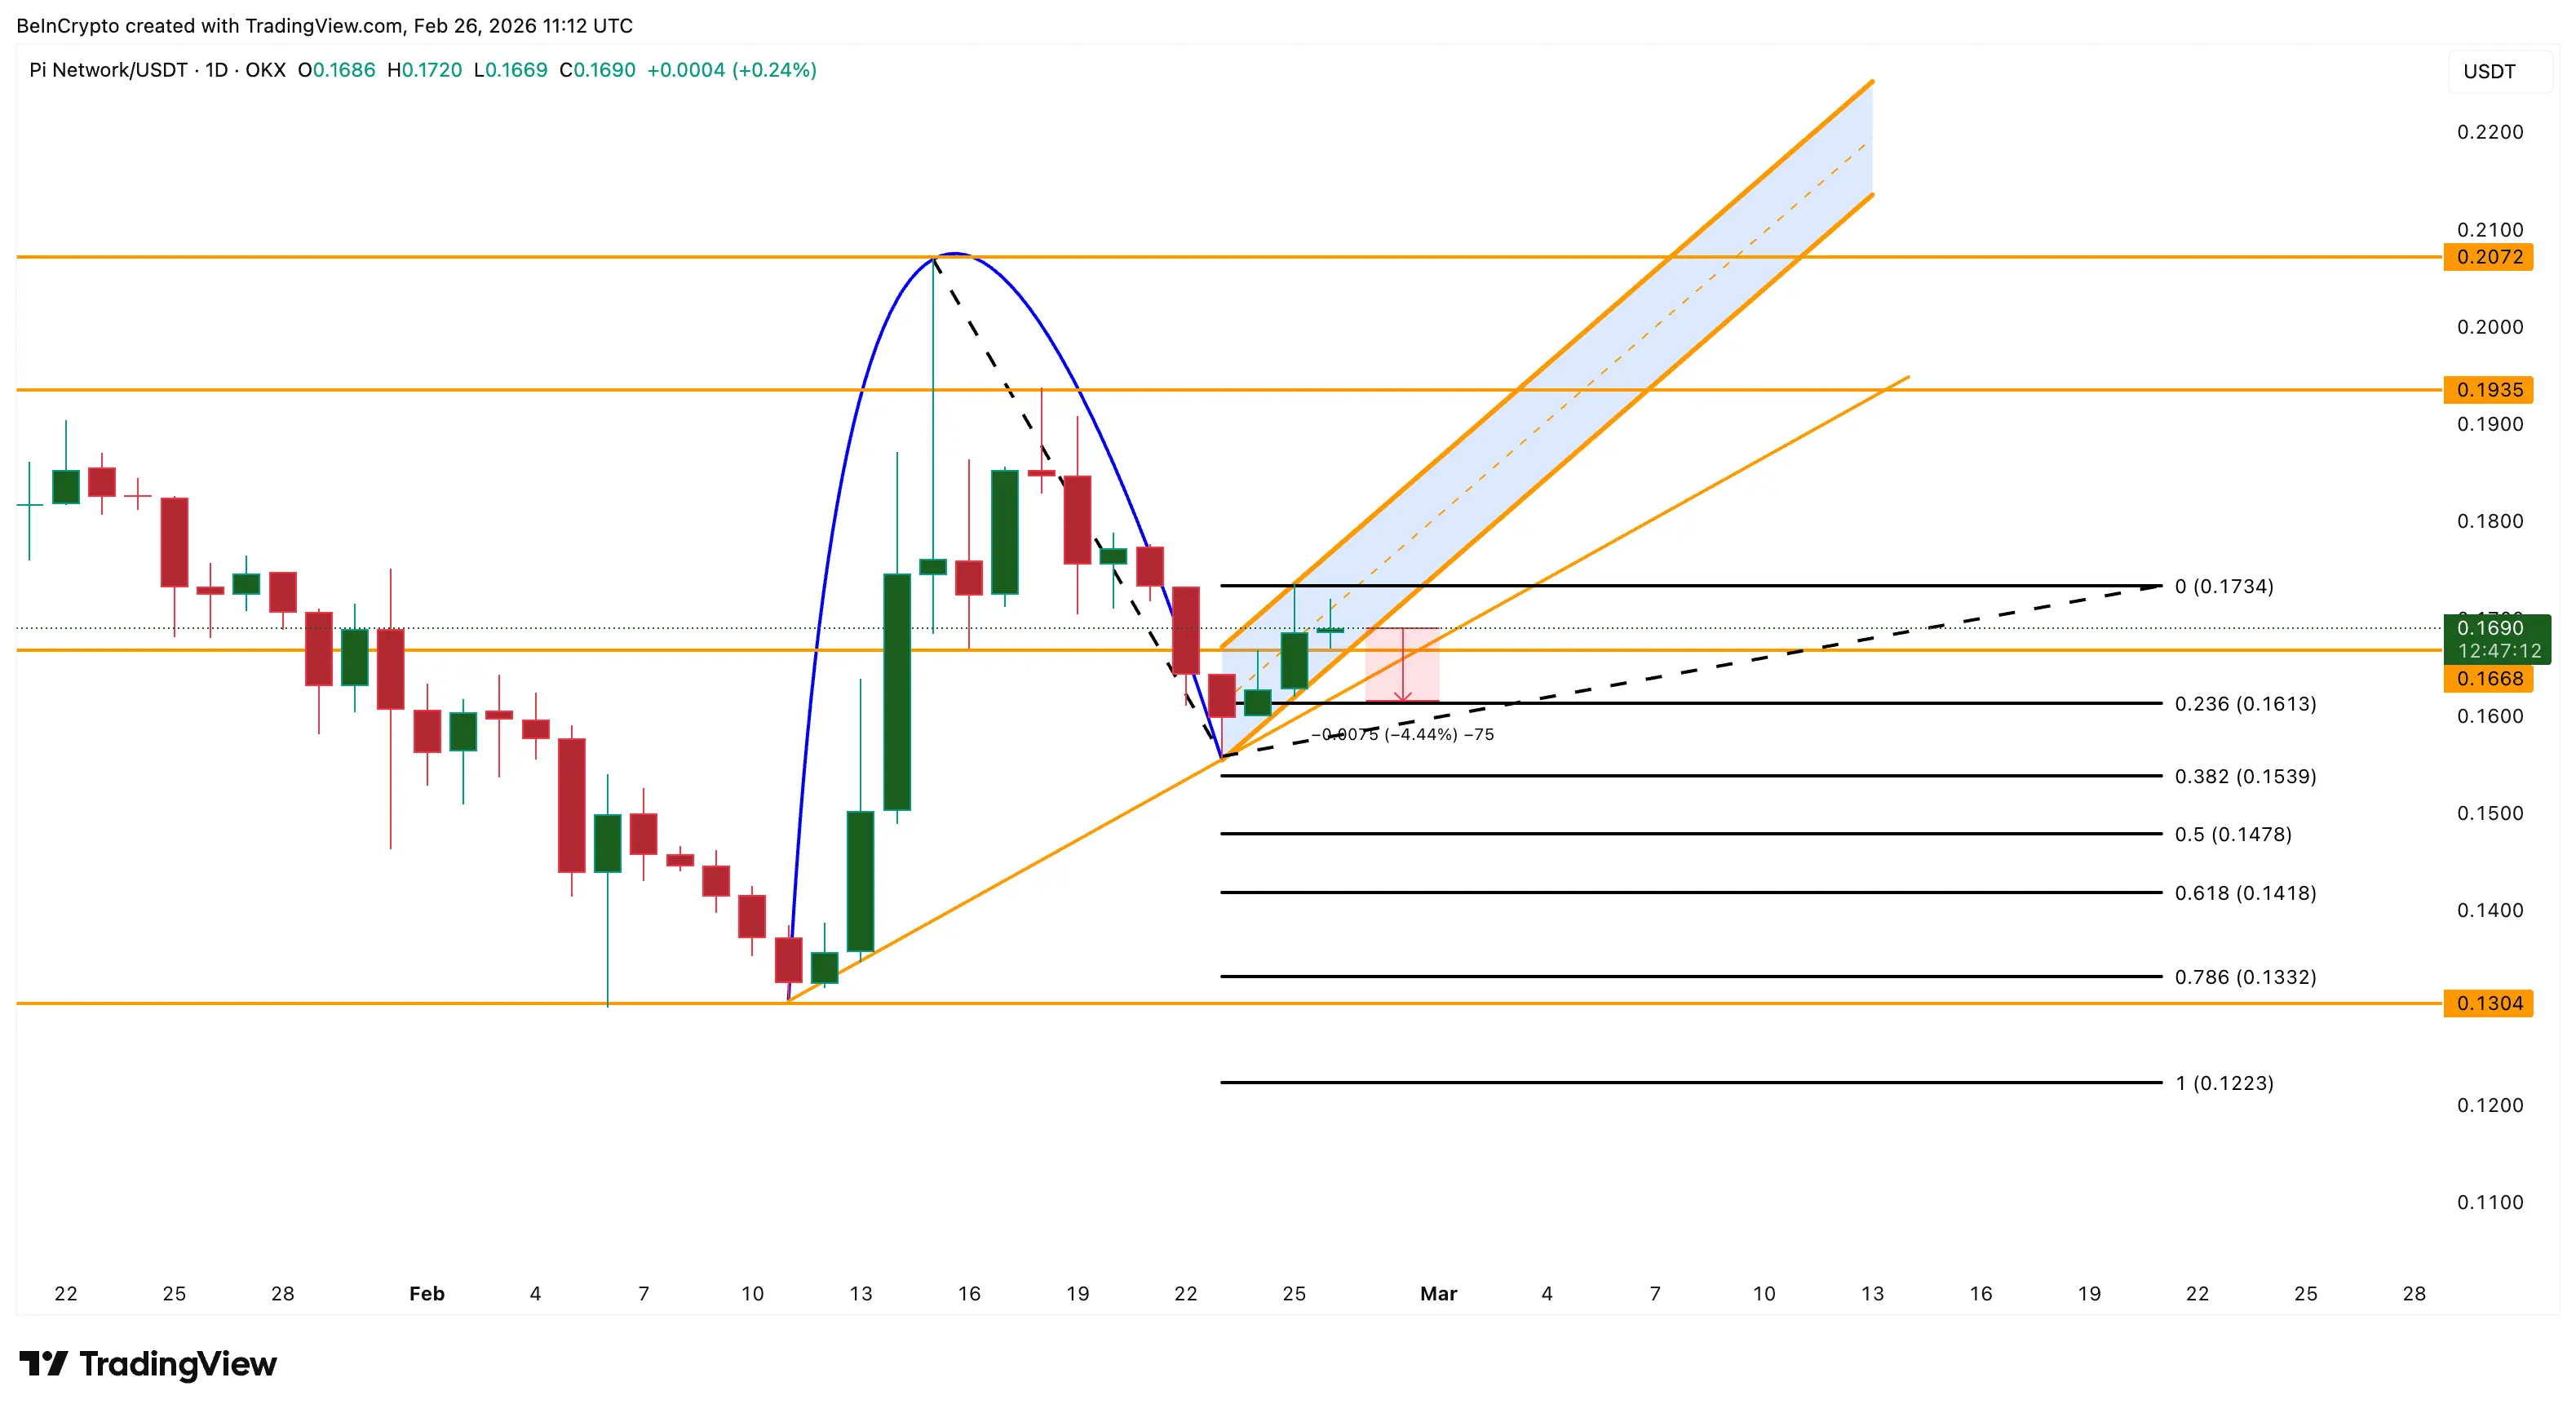
Pi Coin has rebounded approximately 11% from its February 23 low, climbing back to the $0.174 zone, but technical analysis suggests the recovery may be forming the handle portion of an inverted cup-and-handle pattern, a bearish continuation structure that often precedes price declines.
While retail dip-buying has pushed On-Balance Volume higher, the Chaikin Money Flow remains negative and below zero, indicating larger investors may be selling into the rally, creating conditions for a potential breakdown if key support levels fail.
Bearish Pattern Formation Despite Price Recovery
Pi Coin’s current price rebound is developing within an inverted cup-and-handle pattern, a technical formation typically associated with trend continuation rather than reversal. The recent rise represents the handle portion of this structure, which often appears strong but tends to fail below resistance and lead to breakdowns.
The price is approaching a critical juncture where the pattern’s validity will be tested. A move above $0.173 would show early strength returning, while a break above $0.193 would weaken the bearish pattern significantly. A move above $0.207 would invalidate the bearish structure completely.
Contradictory Volume and Money Flow Signals
Money and volume indicators reveal a dangerous contradiction beneath the surface recovery. The On-Balance Volume (OBV), which tracks buying volume, has been rising steadily since February 23, confirming that traders are actively buying the dip and supporting the rebound.
The Money Flow Index (MFI) reinforces this observation, having formed higher lows between February 16 and February 23 even as Pi Coin price continued falling and formed lower lows. This creates a bullish divergence in MFI, indicating that buying pressure increased while prices declined.
However, the Chaikin Money Flow (CMF), which tracks whether capital is entering or leaving an asset, tells a different story. The CMF has been falling steadily and remains below zero, showing that overall capital is still exiting Pi Coin despite the price recovery.
This creates another bearish divergence: between February 11 and February 24, Pi Coin price trended higher while CMF trended lower. This pattern strongly suggests that larger investors may be selling into the rebound while retail traders continue buying, a behavior often observed before breakdowns.
Hidden Momentum Weakness
The weakness becomes clearer when examining momentum strength relative to price structure. Between January 27 and February 25, Pi Coin price formed a lower high, confirming that the rebound remained weaker than the previous rally and that the broader trend remains downward.
Simultaneously, the Relative Strength Index (RSI) formed a higher high during this period, creating a hidden bearish divergence. A hidden bearish divergence occurs when momentum rises but price fails to break resistance, typically signaling that buyers are losing control and the rebound may soon reverse.
When this divergence appears inside a bearish chart pattern, the probability of a breakdown increases. This technical configuration suggests that even though Pi Coin price is rising, sellers may still maintain control of the broader trend.
Critical Price Levels to Watch
Pi Coin is approaching the most consequential stage of this technical structure. If the price falls below $0.161, the bearish inverted cup-and-handle breakdown would likely confirm. Such a move could push Pi Coin toward $0.130 (the current cycle low) and potentially as low as $0.122, which would mark a new low and confirm that the 11% rebound was only a temporary recovery inside a larger downtrend.
 (Source: TradingView)
Recovery remains possible if buyers regain control. Key resistance levels to monitor include $0.173 for early strength, $0.193 to meaningfully weaken the bearish pattern, and $0.207 to invalidate the bearish structure completely.
Until those resistance levels are reclaimed, the risk persists that Pi Coin’s rebound is not the start of a sustainable recovery but rather the setup for the next decline.
FAQ: Understanding Pi Coin’s Technical Setup
Q: What is an inverted cup-and-handle pattern and why is it bearish?
A: An inverted cup-and-handle is a bearish continuation pattern that forms after a downtrend. The “cup” is a rounding bottom, and the “handle” is a short upward consolidation. When price breaks below the handle’s support, it typically signals the downtrend will resume. Pi Coin’s current rebound is forming the handle portion of this pattern.
Q: Why do the volume indicators show conflicting signals?
A: On-Balance Volume and Money Flow Index are rising, indicating retail dip-buying, while Chaikin Money Flow remains negative, suggesting larger investors are exiting. This divergence often appears before breakdowns, as retail buying temporarily supports prices but lacks the institutional backing needed for sustainable moves.
Q: What is a hidden bearish divergence and what does it signal?
A: A hidden bearish divergence occurs when momentum indicators like RSI make higher highs while price makes lower highs. This signals that buying momentum is weakening despite price increases, often preceding trend reversal or continuation of the broader downtrend.
Q: What price levels are critical for Pi Coin’s near-term direction?
A: Support at $0.161 is critical—a break below would likely confirm the bearish pattern and target $0.130 or lower. Resistance levels to watch are $0.173 (early strength), $0.193 (weakens bearish case), and $0.207 (invalidates bearish structure).
Disclaimer: The information on this page may come from third parties and does not represent the views or opinions of Gate. The content displayed on this page is for reference only and does not constitute any financial, investment, or legal advice. Gate does not guarantee the accuracy or completeness of the information and shall not be liable for any losses arising from the use of this information. Virtual asset investments carry high risks and are subject to significant price volatility. You may lose all of your invested principal. Please fully understand the relevant risks and make prudent decisions based on your own financial situation and risk tolerance. For details, please refer to
Disclaimer.
Related Articles
Pi Network Announces v23 Upgrade Roadmap: Smart Contracts and Node Ecosystem as the Core
Pi Network announced a phased plan to upgrade nodes to v23. Version 21.2 will be deployed in April 2026, with future versions supporting smart contracts and enhancing node tools and autonomy. Market feedback is cautiously optimistic, but past delays have kept users on hold. The next few months will be a critical window.
GateNews2h ago
Pi Network (PI) ends 7 months of silence: volatility surges + negative correlation, Bitcoin's rise actually becomes a bearish signal?
Pi Network (PI) has experienced 7 months of low-volatility compression, leading to a clear change in market structure, with the current price around $0.1883. Recent volatility has rebounded above 100%, indicating a new phase in the market, but its rebound potential may be limited by its negative correlation with Bitcoin. Technical analysis shows a potential double-top pattern; if the price drops below $0.1894, it could fall to $0.1527. Short-term trends will be influenced by technical structures and changes in its correlation with Bitcoin.
GateNews3h ago
Pi Coin ends 7 months of "silence": Price ready for major fluctuations
Pi Network (PI) is currently trading around $0.1883, maintaining an accumulation near the 23.6% Fibonacci retracement level after failing to sustain an upward momentum above $0.29.
Two technical signals converging indicate that the “quiet” phase has ended — but in a bearish direction for the bulls.
TapChiBitcoin4h ago
Pi coin's 7-month low-volatility period has ended; an 108% rebound in volatility signals a major market move.
Pi Network (PI) is currently trading at approximately $0.1883, facing increased volatility and a decreasing correlation with Bitcoin. Recently, volatility has risen from 52% to 108%, indicating the end of the past seven months of compression and the potential for a significant move. However, the correlation coefficient between PI and Bitcoin has dropped to -0.30, suggesting that PI has not benefited from Bitcoin's upward trend. Technical analysis shows that if the price falls below $0.1894, it could drop to $0.1300, while holding above $0.2103 may lead to a rebound toward $0.2442.
MarketWhisper6h ago
Pi Network Price Drop Alert: Token Unlock and Profit-Taking Trigger Selling Concerns
Pi Network's price fell approximately 37% this week, failing to break through the key resistance level of $0.20. Supply-side pressure has increased, including large-scale token unlocks and rising exchange reserves, while weak demand is reflected in declining trading volume. In the short term, technical indicators lean bearish, with $0.17 as the key support level for bulls; a break below could lead to further downside toward $0.15. Overall market sentiment is influenced by geopolitical factors, and any rebound will require volume support.
MarketWhisper8h ago
Pi Network Rolls Out Second Mainnet Migration Phase
The latest update from Pi Network introduces a second migration phase for its users, commonly known as Pioneers. This phase allows eligible participants to move additional Pi tokens into the mainnet environment, building on earlier migration efforts that primarily focused on initial token
Coinfomania03-25 10:07
