Trade
Basic
Futures
Futures
Hundreds of contracts settled in USDT or BTC
Options
HOT
Trade European-style vanilla options
Unified Account
Maximize your capital efficiency
Demo Trading
Futures Kickoff
Get prepared for your futures trading
Futures Events
Participate in events to win generous rewards
Demo Trading
Use virtual funds to experience risk-free trading
Earn
Launch
CandyDrop
Collect candies to earn airdrops
Launchpool
Quick staking, earn potential new tokens
HODLer Airdrop
Hold GT and get massive airdrops for free
Launchpad
Be early to the next big token project
Alpha Points
NEW
Trade on-chain assets and enjoy airdrop rewards!
Futures Points
NEW
Earn futures points and claim airdrop rewards
Investment
Simple Earn
Earn interests with idle tokens
Auto-Invest
Auto-invest on a regular basis
Dual Investment
Buy low and sell high to take profits from price fluctuations
Soft Staking
Earn rewards with flexible staking
Crypto Loan
0 Fees
Pledge one crypto to borrow another
Lending Center
One-stop lending hub
VIP Wealth Hub
Customized wealth management empowers your assets growth
Private Wealth Management
Customized asset management to grow your digital assets
Quant Fund
Top asset management team helps you profit without hassle
Staking
Stake cryptos to earn in PoS products
Smart Leverage
NEW
No forced liquidation before maturity, worry-free leveraged gains
GUSD Minting
Use USDT/USDC to mint GUSD for treasury-level yields
More
December 29 | ETH Trend Analysis
Core Viewpoints
Current Price: $3,006.15 (as of December 29, 10:12)
Short-term Outlook: The short-term trend shows oscillating upward movement, with technical indicators on the 1-hour and 4-hour charts indicating bullish momentum. However, RSI has entered overbought territory, posing a risk of a pullback. If the $2,950 support level holds, there is a 70% probability of continuing upward to the $3,050-$3,100 range; a break below $2,900 could trigger a chain liquidation.
Key Support Levels:
Key Resistance Levels:
Technical Analysis
Multi-timeframe Price Trends
1-Hour Level: Strong upward momentum but entering overbought warning zone
4-Hour Level: Medium-term trend confirmed upward
Daily Level: Long-term structure still appears weak
Derivatives Market
Futures Positions and Funding Rates
Total open interest reaches $38.4 billion (+4.48% in 24 hours), increasing with price rise, indicating growing market confidence.
Funding rate on Binance is +0.0097% (longs pay), showing a mild long bias across exchanges. 24-hour liquidation data shows short positions liquidated at $22.6 million versus $5.5 million for longs, confirming a short squeeze scenario.
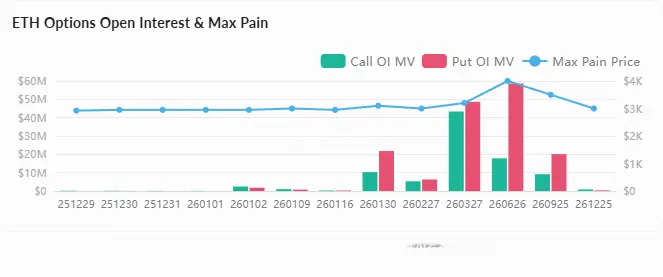
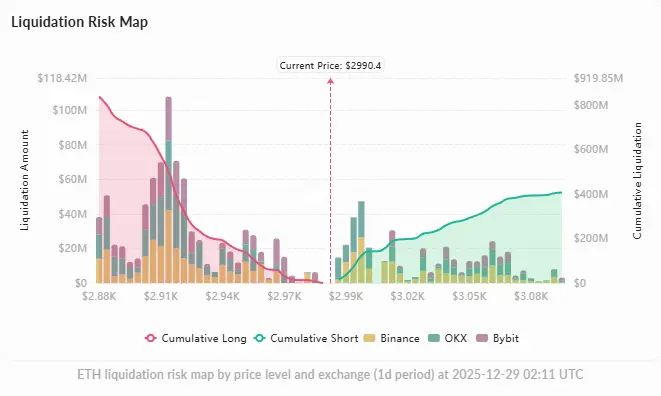
Options Market and Liquidation Risks
Total options open interest is $6.12 billion (+0.87% in 24 hours), with maximum pain concentrated in the $2,950-$3,000 range, exerting a magnetic effect on current price.
Asymmetric liquidation risk distribution:
This distribution suggests that a downward break could trigger more intense chain reactions.
Exchange Capital Flows
7-day net inflow data shows daily net inflows between +11,500 and +154,000 ETH, indicating overall inflow trend. Exchange reserves have increased from 16.3 million ETH to 16.7 million ETH (+2.1%), with increased liquidity potentially exerting downward pressure on price.
Recent whale activity: Address 0xA339d279 sold an average of 24,700 ETH (worth $73 million USDC) over the past week at an average price of $2,954.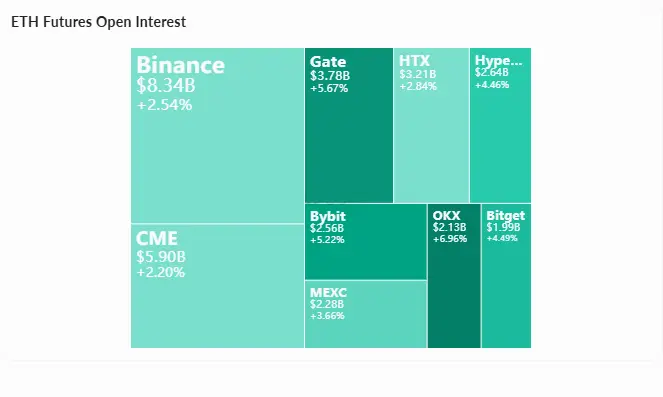
Market Sentiment
Bullish Narrative
Bearish Narrative
Overall Sentiment
Market sentiment is generally neutral with a cautious optimism. Analyst Tom Lee forecasts ETH reaching $7,000-$9,000 this year, with long-term potential of $20,000. Community discussions focus on breaking the $3,000 key resistance, but widespread panic or FOMO has yet to emerge.
Summary
ETH is currently in a short-term bullish phase but with a long-term structural repair needed. The 1-hour and 4-hour technicals are strong, with increasing open interest and short liquidations confirming upward momentum. However, overbought RSI, daily moving average resistance, and rising exchange reserves pose risks of a correction.
The key in the next 24-48 hours is whether $2,950 support can hold. Holding this level could lead to a push toward the $3,050-$3,100 short liquidation zone; breaking below $2,900 risks a bearish cascade. Close attention should be paid to price action around the $2,950-$3,000 maximum pain options zone and derivatives funding rate changes.