Trade
Basic
Futures
Futures
Hundreds of contracts settled in USDT or BTC
TradFi
Gold
Trade global traditional assets with USDT in one place
Options
Hot
Trade European-style vanilla options
Unified Account
Maximize your capital efficiency
Demo Trading
Futures Kickoff
Get prepared for your futures trading
Futures Events
Participate in events to win generous rewards
Demo Trading
Use virtual funds to experience risk-free trading
Earn
Launch
CandyDrop
Collect candies to earn airdrops
Launchpool
Quick staking, earn potential new tokens
HODLer Airdrop
Hold GT and get massive airdrops for free
Launchpad
Be early to the next big token project
Alpha Points
Trade on-chain assets and enjoy airdrop rewards!
Futures Points
Earn futures points and claim airdrop rewards
Investment
Simple Earn
Earn interests with idle tokens
Auto-Invest
Auto-invest on a regular basis
Dual Investment
Buy low and sell high to take profits from price fluctuations
Soft Staking
Earn rewards with flexible staking
Crypto Loan
0 Fees
Pledge one crypto to borrow another
Lending Center
One-stop lending hub
VIP Wealth Hub
Customized wealth management empowers your assets growth
Private Wealth Management
Customized asset management to grow your digital assets
Quant Fund
Top asset management team helps you profit without hassle
Staking
Stake cryptos to earn in PoS products
Smart Leverage
New
No forced liquidation before maturity, worry-free leveraged gains
GUSD Minting
Use USDT/USDC to mint GUSD for treasury-level yields
More
Bt
Gate FunGo to Trade
MC:$0.1Holders:1
0.00%
方舟掘金
 0
0
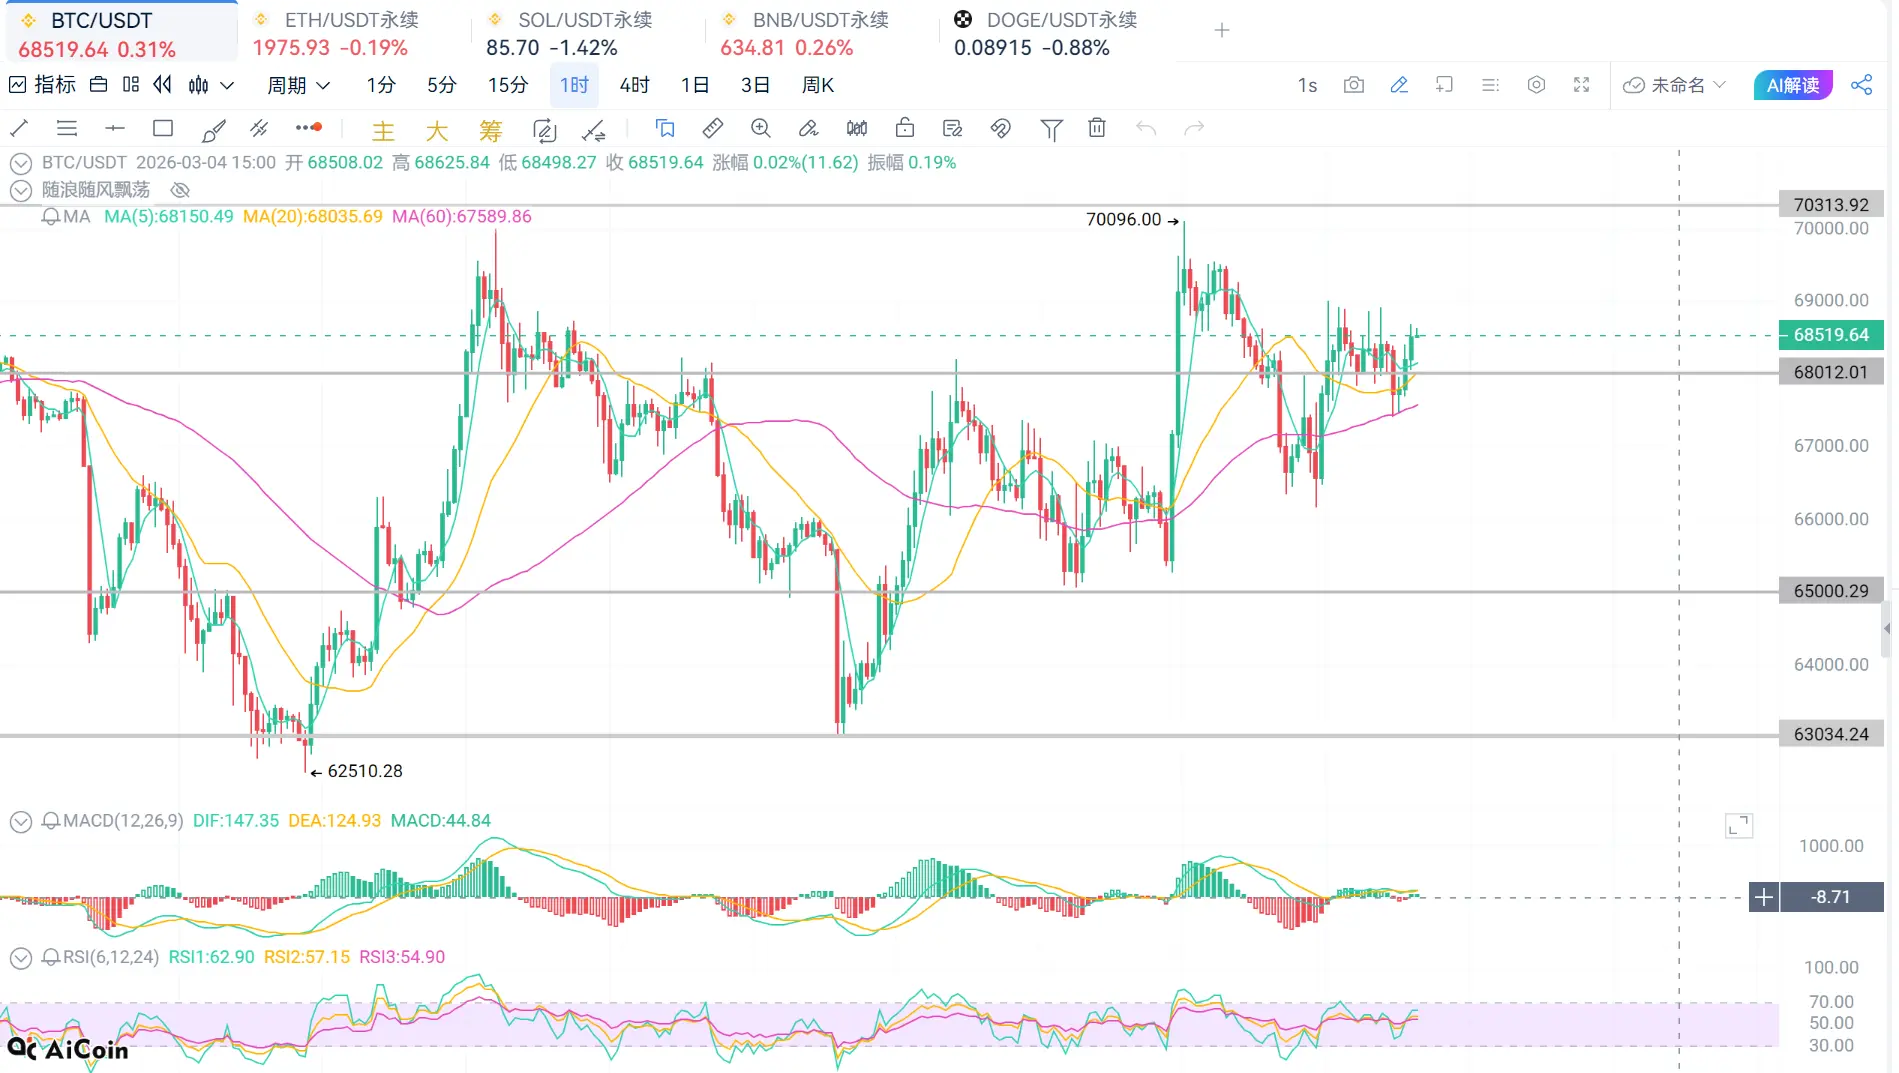
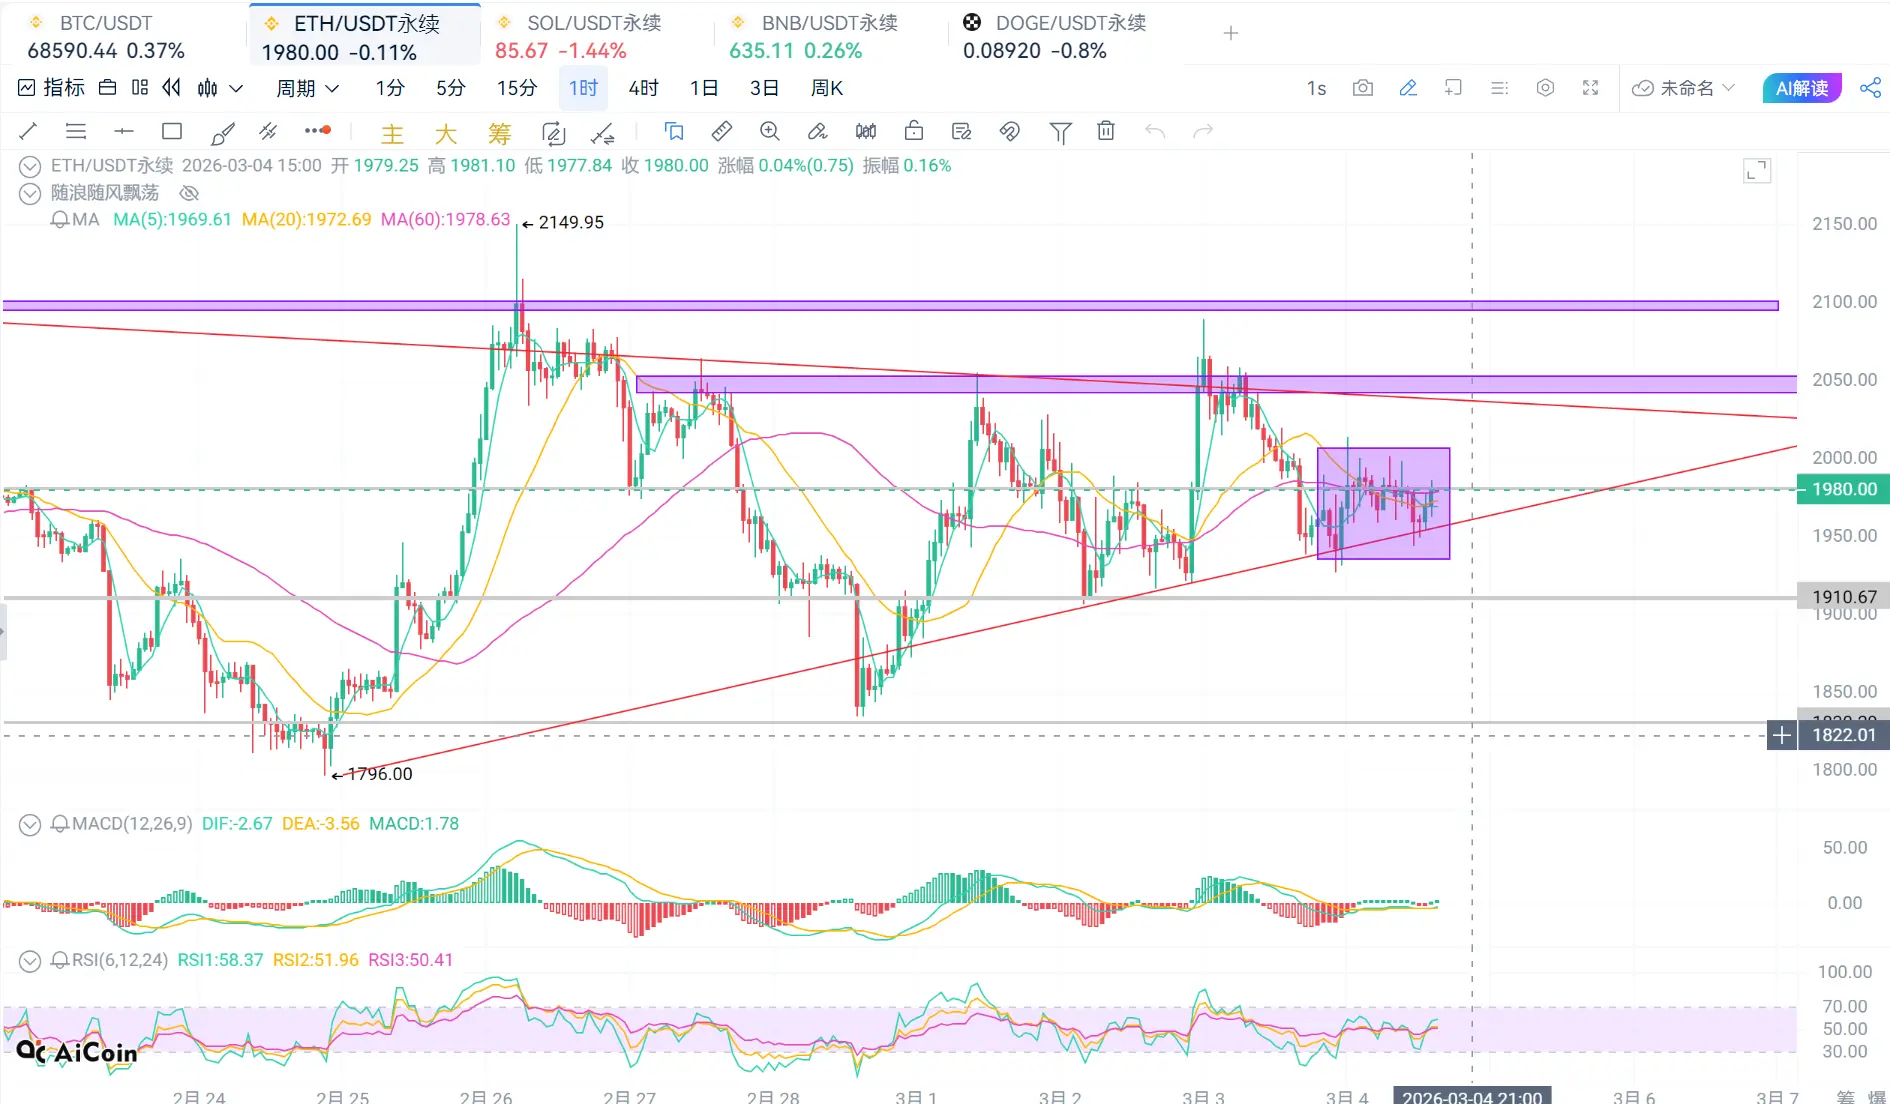
3.4 BTC ETH Market Analysis and Trading Strategies
The current market is in a range-bound consolidation, with BTC moving back and forth between 65,000 and 70,000.
On the daily chart, the overall trend remains bearish, with the 5, 10, and 20-day moving averages all trending downward. Prices are under pressure below all moving averages, and rebounds should be viewed as a trap for late buyers. Without a firm hold above the 68,500–70,000 zone in the short to medium term, a reversal cannot be confirmed.
The 4-hour chart shows a downward channel, with resistance at 68,500–70,000 and support at 65,00
View OriginalThe current market is in a range-bound consolidation, with BTC moving back and forth between 65,000 and 70,000.
On the daily chart, the overall trend remains bearish, with the 5, 10, and 20-day moving averages all trending downward. Prices are under pressure below all moving averages, and rebounds should be viewed as a trap for late buyers. Without a firm hold above the 68,500–70,000 zone in the short to medium term, a reversal cannot be confirmed.
The 4-hour chart shows a downward channel, with resistance at 68,500–70,000 and support at 65,00
- Reward
- 1
- Comment
- Repost
- Share
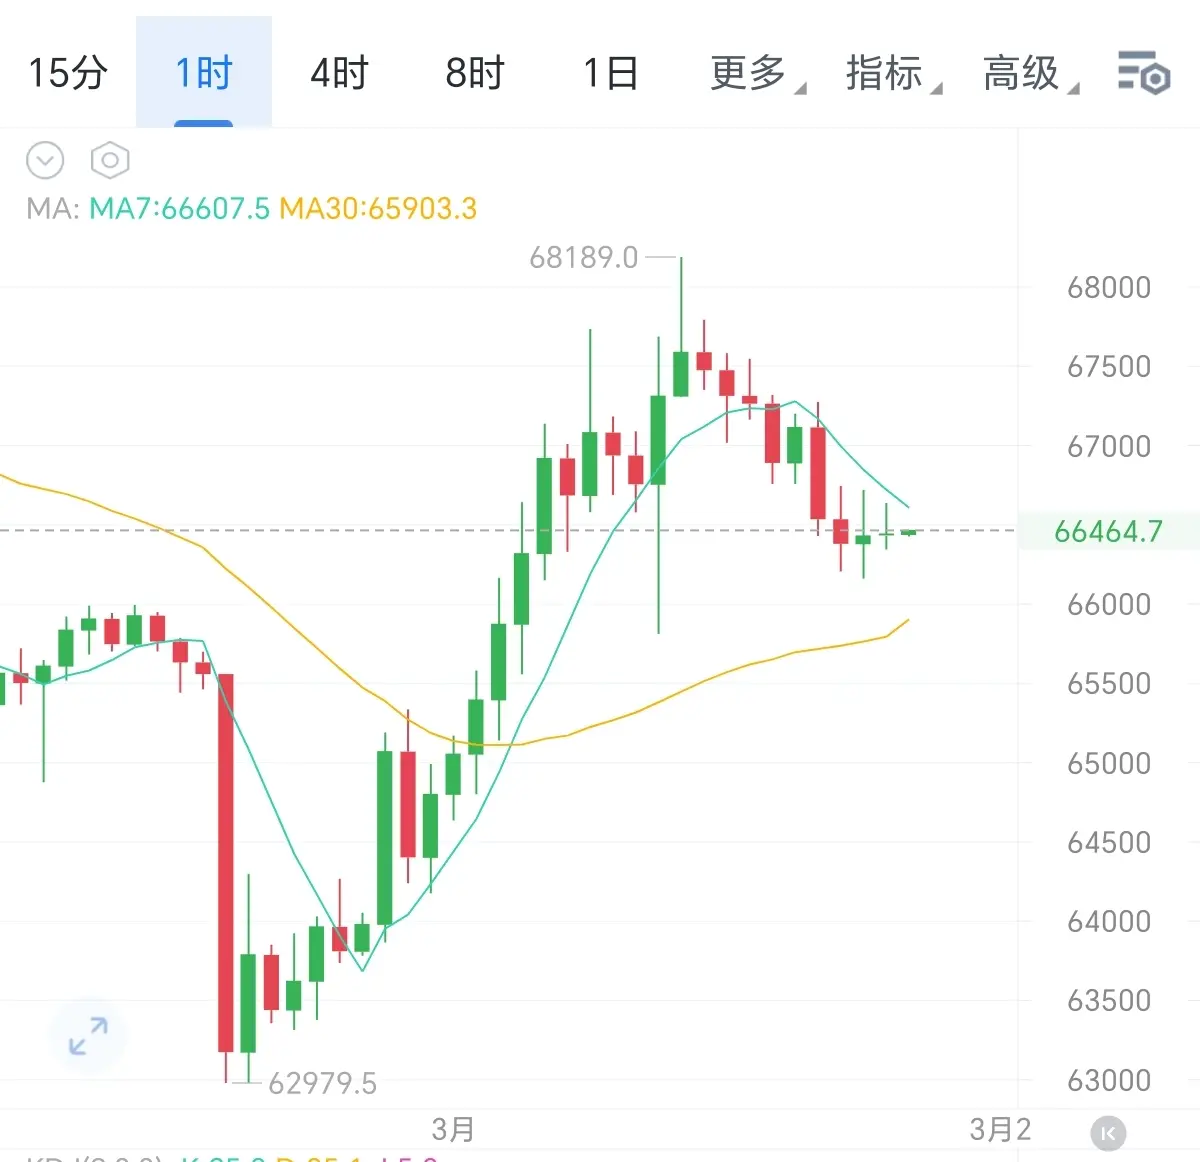
3.1 Bitcoin Analysis
Bitcoin surged to 68189 quickly pulled back, forming a short-term double top on the 1-hour chart. It has broken below the MA7 moving average (66607.5) and the moving average is turning downward, indicating exhausted upward momentum. The volume-price divergence is obvious, with the bearish candlestick body enlarging, and selling pressure continues to accumulate.
Currently, the price is temporarily holding at 66400. Strong support below is seen at the MA30 (65903.3) and the 65500 range. If these levels are broken, the price may decline to 64000-63500. Combined with Federal R
BTC8,24%
- Reward
- 2
- Comment
- Repost
- Share
Join 40M users in our growing community
⚡️ Join 40M users in the crypto craze discussion
💬 Engage with your favorite top creators
👍 See what interests you
Hot Gate Fun
View More- MC:$2.43KHolders:10.00%
- MC:$2.44KHolders:20.00%
- MC:$2.41KHolders:00.00%
- MC:$0.1Holders:10.00%
- MC:$2.45KHolders:20.02%
- MC:$0.1Holders:10.00%
- MC:$0.1Holders:10.00%
- MC:$2.43KHolders:10.00%
- MC:$2.43KHolders:20.00%
- MC:$2.39KHolders:10.00%
News
View MoreBlackRock has net inflowed 17,642 BTC since February 24, approximately $1.28 billion.
3 m
Insider: OpenAI may sign an AI deployment contract with NATO
5 m
In the first year of Trump's second term, the U.S. federal government laid off 386,826 people.
7 m
Wintermute Analyst: Capital has begun a phased shift towards cryptocurrencies, and BTC outperforming US stocks may be due to capital rotation
8 m
Accenture acquires the parent company of Speedtest, Ookla, for $1.2 billion.
10 m
Pin