
Aster (ASTER) is once again facing trouble at the $0.80 level, and the repeated rejection is starting to raise concerns. What once looked like a potential breakout is now turning into a clear area of resistance that the price simply can’t overcome.
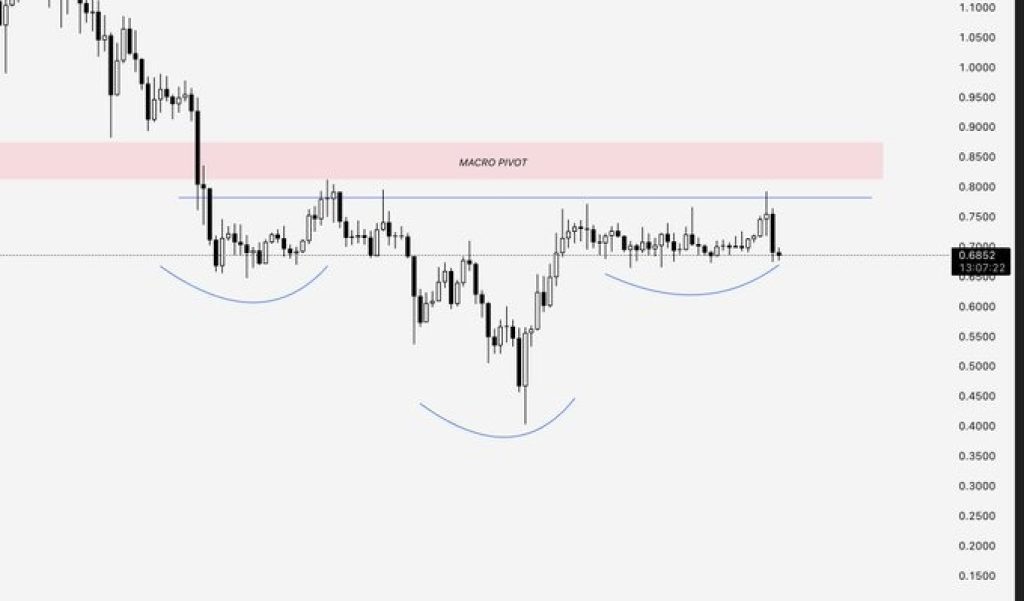
This level has held firm since December, acting as a macro pivot where price repeatedly stalls. Each time the ASTER price tries to move towards $0.80, sellers intervene to push the price back down.
Until now, there has been no strong close on the price above that level, indicating that buyers are not in control.
- Here’s What the ASTER Chart Is Showing
- Trapped Traders Could Trigger a Sell-Off For ASTER
- What Happens Next For ASTER?
Here’s What the ASTER Chart Is Showing
We also took a look at the chart and saw that the price movement for ASTER was forming what looked like an inverse head and shoulders pattern.
This is typically seen as a bullish reversal pattern and is used to indicate that the price movement may rise from this position after a certain trend.
For this to happen, however, ASTER had to break past $0.80. Instead, it got rejected again.
This failure is important. When a bullish setup doesn’t play out, it often leads to the opposite move. In this case, the rejection adds more weight to the bearish side and increases the chances of a downside move.
_****ChatGPT Predicts Solana (SOL) Price if Bitcoin Reaches New All-Time High in 2026**
Source: X/Ardi
However, after the rejection, the ASTER price has dropped back toward the lower end of its recent consolidation range. This area has acted as support before, helping price bounce multiple times.
But now, it’s being tested again, and this time with weaker momentum.
If this support holds, ASTER could stabilize and attempt another move higher. But if it breaks, there isn’t much structure below to stop the fall. The next major support level sits around $0.60, which becomes the likely target in a breakdown scenario.
_****XRP Price Could Resume Journey to New All-Time High if This Key Level Holds**
Trapped Traders Could Trigger a Sell-Off For ASTER
Another key factor to watch is trader positioning. Many traders likely entered during the breakout attempts near $0.80. With prices now below that level, those positions are sitting at a loss. This creates pressure in the market.
If support gives way, these traders may rush to exit their positions to avoid further losses. That wave of selling can accelerate the drop, creating what’s often called a cascade.
This is how fast and sharp declines usually start.
What Happens Next For ASTER?
Right now, ASTER is at a critical point. If buyers can step in and push the price back toward the upper range, there’s still a chance for another test of $0.80.
But the longer the ASTER price stays below that level, the weaker the bullish case becomes.
On the other hand, if support breaks, the downside could open up quickly. In that case, a move toward $0.60 would not only be possible, it could happen faster than expected.
Disclaimer: The information on this page may come from third parties and does not represent the views or opinions of Gate. The content displayed on this page is for reference only and does not constitute any financial, investment, or legal advice. Gate does not guarantee the accuracy or completeness of the information and shall not be liable for any losses arising from the use of this information. Virtual asset investments carry high risks and are subject to significant price volatility. You may lose all of your invested principal. Please fully understand the relevant risks and make prudent decisions based on your own financial situation and risk tolerance. For details, please refer to
Disclaimer.
Related Articles
BTC edges up 0.46% in 15 minutes: institutional fund outflows and macro risk-off sentiment in sync drove the move
From 15:00 to 15:15 (UTC) on 2026-04-16, BTC logged a +0.46% return within 15 minutes. The price fluctuated in a range of 73,939.7 to 74,440.0 USDT, with an amplitude of 0.68%. During this time window, market attention increased, short-term volatility intensified, and fund-flow characteristics changed noticeably.
The main driver of this deviation is the continued outflow of large amounts of capital from exchanges. According to on-chain data, in the past 24 hours the net flow was -14,408.84 BTC, mainly concentrated in large transfer ranges of more than $1 million (especially>$10M net outflow -12,987.03 BTC). This shows that institutions and large holders actively reduced their BTC holdings on exchanges, and short-term selling pressure was significantly lowered. Against the backdrop of persistently weak liquidity, with order book depth remaining at a low level for a long time, the price has become more sensitive to medium-sized buy orders—amplifying the impact of even modest inflows on spot market price action.
In addition, macro conditions changed in parallel and produced a synchronized effect: easing geopolitical tensions in the Middle East boosted overall market sentiment. International gold prices rose, global equity markets hit new highs, and the market re-evaluated the probability of the Federal Reserve cutting rates within the year, further increasing investor attention to safe-haven assets (including BTC). At the same time, on-chain data indicates that the “whale” trading activity during this phase is at an annual low (>$1M transfers fell to 1,485 transactions). With heavy market wait-and-see sentiment and limited short-term supply, BTC’s responsiveness to sudden buy-side capital was further enhanced.
Investors should be reminded that current market liquidity is still fragile. Insufficient order book depth increases the market’s sensitivity to large capital movements, and short-term volatility may intensify. Going forward, focus on further shifts in on-chain large-fund flows, changes in price action as it breaks through support or resistance regions, and the risks and opportunities brought by related macro policies and geopolitical developments. Please continue to track key data and stay alert to any sudden shocks during the period of abnormal moves.
GateNews19m ago
XRP Rises 4% as Ripple Partnership and ETF Inflows Drive Recovery
XRP rose 4% to $1.41, boosted by Ripple's partnership with Kyobo Life and increasing institutional interest. Broader market gains and positive community engagement also contributed, though XRP remains 63% below its peak. Key support is at $1.38.
GateNews7h ago
ETH/BTC ratio rebounds—are institutional funds rotating? A deep dive into structural signals in the crypto market
BTC breaks through $75,000; the Iran–Israel ceasefire and fresh highs in U.S. stocks lift risk assets, but the options market remains somewhat cautious. The ETH/BTC ratio rebounds, signaling capital rotation.
GateInstantTrends8h ago
Crypto Market Rebounds 1.5% to $2.54T as Bitcoin Leads Rally Amid Tech Surge and Policy Progress
The crypto market rebounded 1.5% to $2.54 trillion, led by Bitcoin's 7% gain amid easing geopolitical tensions and strong ETF inflows. Analysts predict further gains if Bitcoin surpasses $76K resistance.
GateNews8h ago
Bitcoin bull market index rises to 40 points; Bloomberg: the U.S. and Iran are considering extending the ceasefire agreement by two weeks
Bitcoin’s price as of April 16 is approaching $74,700. The Bullish Sentiment Index (BSI) has risen to 40 points, indicating a rebound in market sentiment. The United States and Iran are evaluating options to extend the current ceasefire agreement, and they are also discussing navigation issues in the Strait of Hormuz, as diplomatic negotiations continue.
MarketWhisper14h ago
