Hyperliquid’s native token $HYPE recently attempted a rebound from lows, but Coinglass’s liquidation map shows approximately $28.9 million in short positions concentrated above the $35 level. Meanwhile, the MACD indicator experienced a bullish crossover on Sunday, signaling a potential technical trend reversal.
Liquidation Map Analysis: The $35 Key Breakout Point
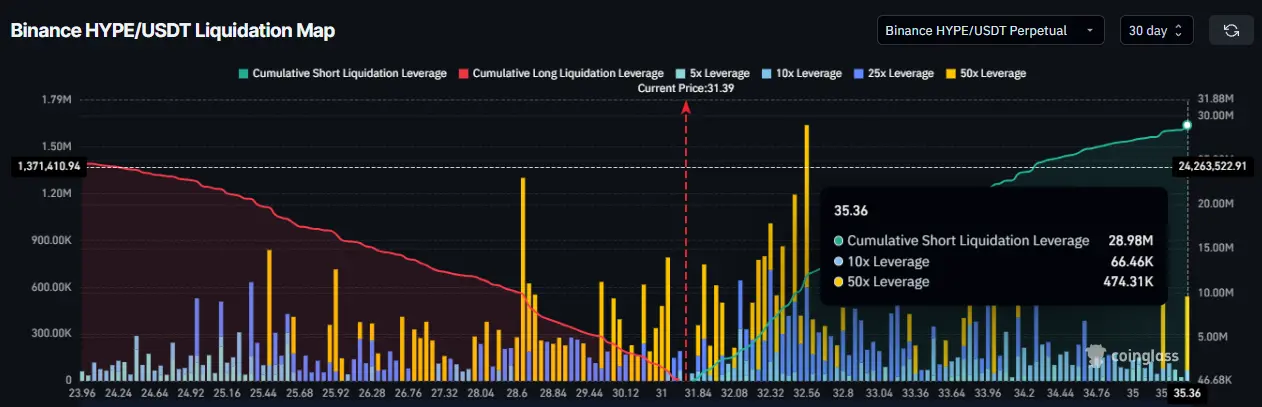
(Source: Coinglass)
Hyperliquid’s liquidation structure exhibits a clear directional asymmetry: currently, high-liquidity contracts are dominated by short positions, with over $28.9 million in shorts heavily concentrated around the $35 price level.
This concentration of shorts can be interpreted from two perspectives:
On one hand, the large number of short positions reflects market expectations that $HYPE will continue its downtrend, creating technical selling pressure. On the other hand, the dense cluster of shorts also sets the stage for a potential upward catalyst—if buying momentum drives $HYPE to decisively break through $35, forced short covering will trigger a chain reaction, amplifying the upward move. This “short squeeze” could push the price rapidly toward the $38 region, as technical analysis suggests.
At around $38, the distance between the 50-day and 200-day moving averages may narrow further. If, after short liquidation, these moving averages form a golden cross, it would serve as a stronger confirmation of a medium-term bullish structure.
Technical Signals and Key Price Levels
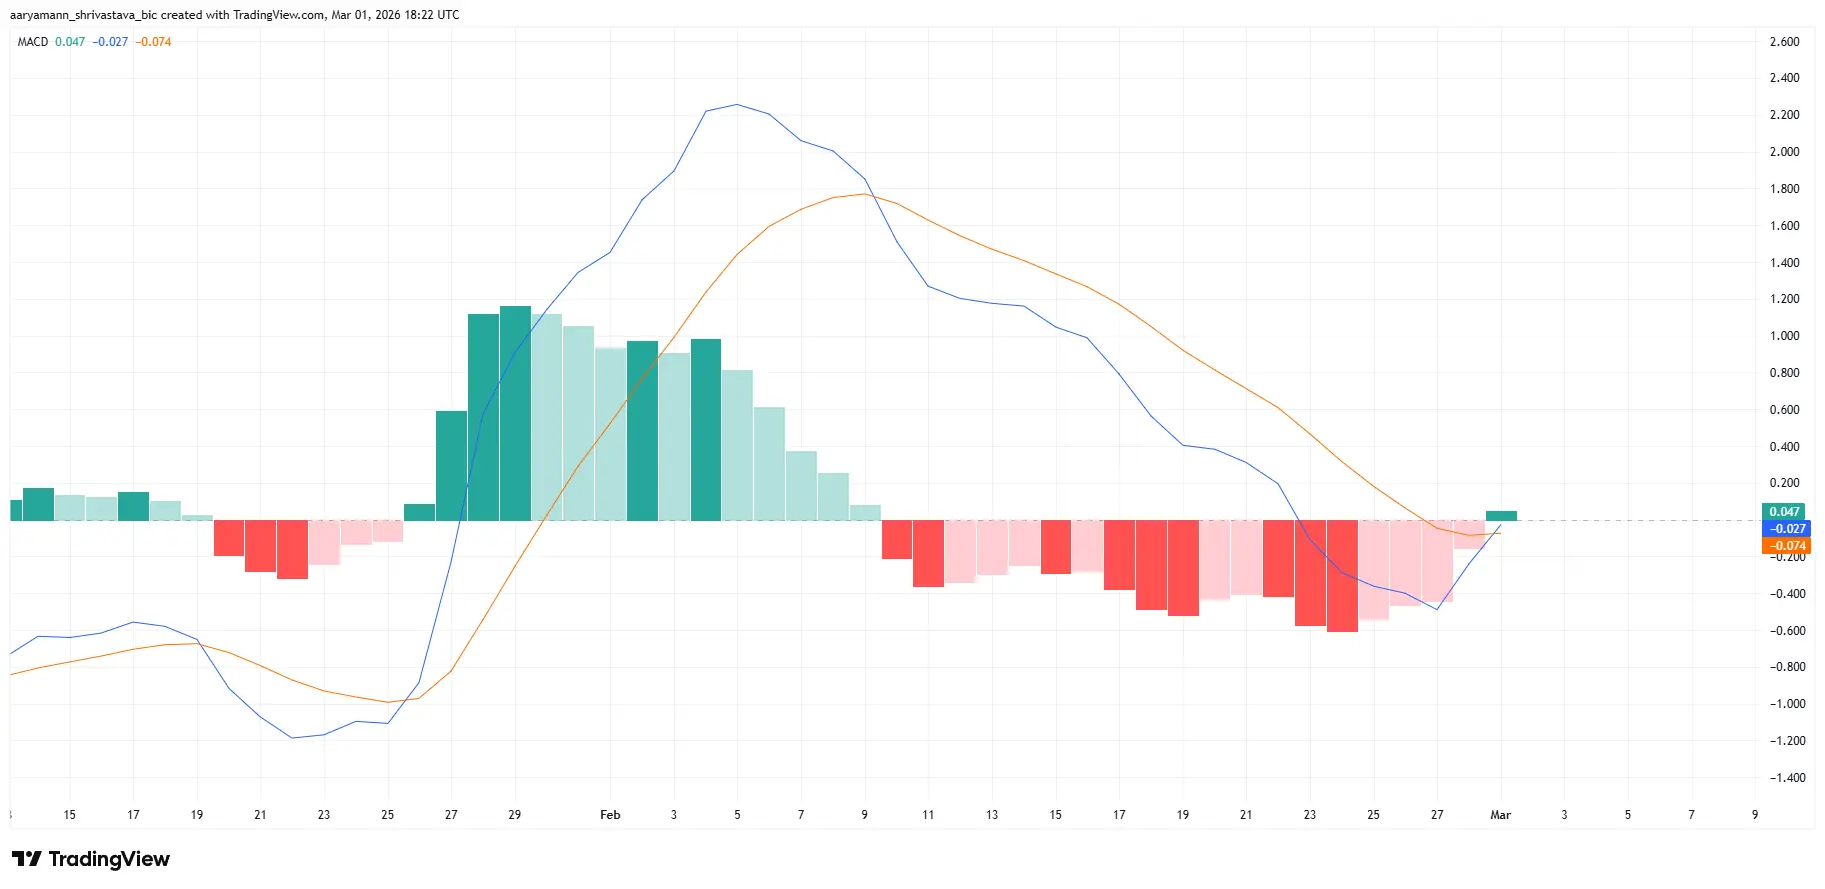
(Source: TradingView)
Beyond the liquidation structure, technical indicators provide initial positive signals for short-term momentum.
The MACD (Moving Average Convergence Divergence) experienced a bullish crossover on Sunday, with the DIF line crossing above the DEA line, a common short-term buy signal in technical analysis. The narrowing and turning positive of the histogram suggest that selling momentum may be weakening. If spot buying demand aligns with these technical signals, $HYPE could gradually establish a stable upward trend in the near term.
Key technical levels to watch are:
- First Resistance: $34 — immediate overhead pressure for spot price
- Core Liquidation Trigger: $35 — short position concentration zone; breaking through could trigger a chain reaction
- Short Squeeze Target: $38 — price target after $28.9 million short liquidation
- First Support: $30 — critical bottom line protecting the bullish structure
- Secondary Support: $26 — next major support if $30 fails
Frequently Asked Questions
Q: Why does the $HYPE short liquidation at $35 amplify the price movement?
In futures markets, traders holding short positions typically set stop-loss orders just above key resistance levels. When the price breaks above $35, many stop-loss orders are triggered automatically, forcing traders to buy back (cover) their shorts. This forced buying adds to the upward momentum, accelerating the price increase—creating a short squeeze. The $28.9 million concentrated liquidation can generate significant volatility in a short period.
Q: Is the MACD bullish crossover enough to confirm a trend reversal for $HYPE?
A MACD crossover is a short-term bullish signal indicating increasing buying momentum, but it alone is insufficient to confirm a trend reversal. Analysts usually recommend combining it with volume analysis, spot market strength, and other momentum indicators like RSI. Given the current macro environment—geopolitical tensions and overall market risk appetite—this initial technical signal needs macro confirmation to be reliable.
Q: If $HYPE falls below $30 support, what signals should investors watch?
$30 is the current structural support that has maintained the upward trend for over a month and a half. A breakdown below this level would shift the focus to the next support at $26, and the bullish structure would be invalidated. Investors should monitor whether volume increases during the decline (confirming genuine selling pressure) and whether spot funds are flowing out (net outflows), which would indicate the breakdown’s sustainability.
Disclaimer: The information on this page may come from third parties and does not represent the views or opinions of Gate. The content displayed on this page is for reference only and does not constitute any financial, investment, or legal advice. Gate does not guarantee the accuracy or completeness of the information and shall not be liable for any losses arising from the use of this information. Virtual asset investments carry high risks and are subject to significant price volatility. You may lose all of your invested principal. Please fully understand the relevant risks and make prudent decisions based on your own financial situation and risk tolerance. For details, please refer to
Disclaimer.
Related Articles
Crypto Jack Warns Bitcoin May Drop to $48K Amid Geopolitical Tensions
Crypto trader Crypto Jack warns investors to sell Bitcoin, predicting a decline to $48,000 amidst US-Iran tensions and negative financial signals, before a potential recovery in May based on seasonal trends.
CryptoFrontier28m ago
Bitcoin’s fourth halving rally is slowing down, analysts say: BTC may have entered a “new normal”
Investment firm Galaxy analyst Alex Thorn noted that Bitcoin’s advance during this halving cycle has been lower than historical records, with volatility declining, and the market may be entering a new normal. Compared with the past three halvings, the fourth time’s price change is no longer significant. While the passage of U.S. spot ETFs has catalyzed the rally, the market’s ongoing conditions still need to be watched closely.
ChainNewsAbmedia46m ago
ETH jumps 1.22% in 15 minutes: DeFi segment activity and trading volume surge resonate to drive the move
2026-04-20 07:15 to 07:30 (UTC), ETH’s short-term return reached +1.22%. The price range spanned from 2285.19 to 2332.62 USDT, with a 2.07% amplitude. During this period, market attention heated up, volatility noticeably intensified. On-chain transaction volume rose in tandem, and key mainstream on-chain activity indicators expanded significantly on a month-over-month basis.
The primary driver of this deviation was an increase in transaction activity related to DeFi protocols, which boosted the share of on-chain Gas consumption. At the same time, total on-chain transaction volume saw a sharp surge in a short time. DeFi scenarios such as decentralized exchanges and lending protocols led to a direct surge in demand for ETH, driving funds to flow quickly into the market. In addition, the average Gas fees and Gas prices on the ETH network continued to climb in this window, further validating that high-frequency trading and active capital were accelerating into the market and strengthening short-term bullish sentiment.
Second, on-chain data also showed an expansion in liquidity related to stablecoins and ERC20 assets, strengthening market buy-side power. Although historical large-wallets such as Wilcke still held a large amount of ETH after early March, this cycle did not trigger abnormal transfers or large-scale sell-offs. Meanwhile, the positioning structure of mainstream ETH did not show passive deleveraging or concentrated liquidation. Under the combined effects of multiple factors, global buy-side demand was amplified, and short-term ETH volatility was further elevated.
Be alert to the risk of capital sustainability after a surge in high-frequency trading volume and Gas fees. If subsequent incremental buying is lacking or on-chain attention cools down, ETH may face short-term pullback pressure. Monitor changes in large-holder positions, any abnormal shifts in network fees, and liquidity volatility on the DeFi protocol chain. While there have been no signs of security incidents involving major contracts and protocols so far, short-term liquidity disturbances still need close observation. Keep monitoring fund flows and on-chain structure to stay informed about subsequent market changes.
GateNews1h ago
Bitcoin Dominance Approaches 59.9% Resistance, Altseason Signals Emerge
Bitcoin dominance has reached 59.9%, nearing a key resistance level. If rejected, analysts predict a capital shift to altcoins, potentially leading to an "altseason," as past trends show this often initiates rallies in smaller assets.
GateNews1h ago
BTC rises 0.58% in 15 minutes: whale large-capital transfers and derivatives defensive positioning drive spot buying
2026-04-20 06:30 to 2026-04-20 06:45 (UTC), the BTC price recorded a +0.58% return rate. The candlestick range was 74347.7 to 74898.0 USDT, with an amplitude of 0.74%. During this period, market attention increased because large orders and on-chain capital flow showed abnormal fluctuations, resulting in a higher overall volatility.
The main driver behind this anomalous move is whale entities concentrating large withdrawals and transfers targeting exchanges. Over the past 24 hours, the total reached 3,824 BTC, directly reducing the exchange’s BTC liquidity and bringing increased buy pressure to the spot market. On-chain data shows that the value of large transfers per transaction exceeding 1 million US dollars rose significantly during this window. As exchange immediate liquidity contracted, it pushed the BTC price upward in the short term. In addition, the derivatives market’s positioning structure changed: total futures open interest (OI) fell, and some defensive options positions shifted toward spot buying, further strengthening upside momentum.
Second, overall market liquidity remains in a fragile range. Order book data shows that large market buy orders were heavily concentrated, and buy-side depth increased noticeably. Meanwhile, in the same period, market Mempool activity and on-chain transaction fees were at low levels, and trading activity declined—making the impact of large single transfers and buy orders on price more pronounced. At the same time, leveraged funds leaving the derivatives market and options’ “maximum pain” strike price being below the spot price increased the spot market’s sensitivity to volatility. With multiple factors converging, the short-term upward price impulse was amplified.
Currently, market liquidity risk is rising, and in the short term the price is dominated by large buy orders in the order book and on-chain whale liquidity. Traders should continue to monitor the direction of whale capital flows and changes in exchange reserves, and be alert to possible price pullbacks caused by capital returning. At the same time, the key support range (72,000–74,000 USDT), order book depth, and derivatives positioning structure remain the core monitoring indicators for near-term volatility. Investors should be mindful of the risks stemming from fragile short-term liquidity and keep an eye on more real-time market developments.
GateNews1h ago
Spark's Prudent ETH Lending Strategy Proves Justified as Aave Faces Liquidity Crisis Across Multiple Chains
Spark's strategy chief defended maintaining high borrowing rates on SparkLend despite user migration to Aave, citing current market conditions. Aave is experiencing liquidity issues, raising concerns about potential bad debt if ETH prices drop significantly.
GateNews1h ago
