Bitcoin’s rally quickly took off as prices adjusted on Tuesday, and it is now trying to hold the psychological level of $69,000 during Wednesday’s trading session. According to data from SoSoValue, Bitcoin ETF funds recorded a net inflow of up to $257.7 million on Tuesday — the highest since February 6. This movement indicates that many investors see dips near the $60,000 zone as attractive opportunities to accumulate.
In a post on X, Santiment stated that the correlation between BTC and the stock market has weakened significantly over the past six months. While the S&P 500 index has increased by about 7% during this period, Bitcoin has plunged by 43%. However, this on-chain data analysis platform suggests that such “phase shift” conditions are unlikely to last long. If Bitcoin reverts to its historical pattern — growing in tandem with stocks during economic expansion cycles — then BTC still has considerable room to recover and catch up with traditional markets.
Nevertheless, not all signals are optimistic in the short term. Glassnode warns that the realized profit/loss ratio of BTC (90-day moving average) has fallen below 1. In the past, whenever this indicator dipped below that threshold, the market typically experienced at least six months of losses before a positive trend resumed.
So, do Bitcoin and major altcoins have enough momentum to break through upcoming resistance levels? Let’s analyze the charts of the top 10 cryptocurrencies for insights.
Technical Analysis of BTC
BTC surged from $62,510 on Tuesday, indicating strong bullish protection around the $60,000 zone.
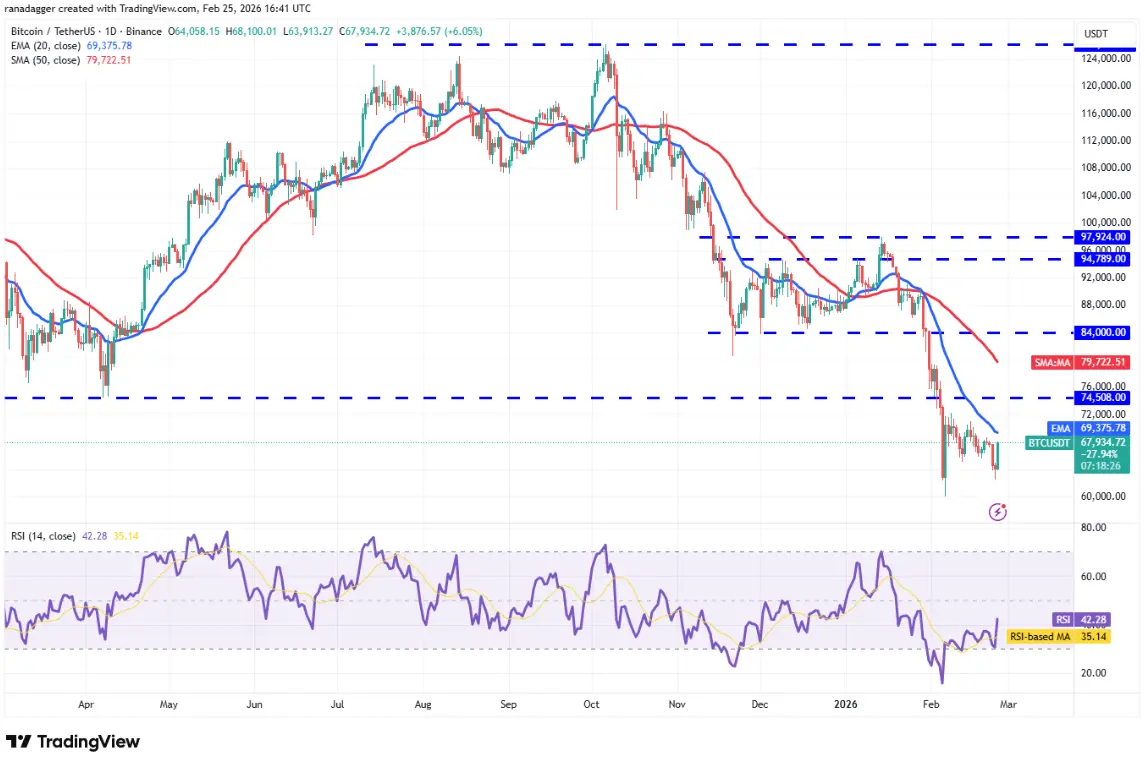 Daily BTC/USDT Chart | Source: TradingView Buyers will attempt to push the price above the 20-day exponential moving average (EMA) at $69,375. If successful, the BTC/USDT pair could rise to $74,508 — the previous breakout zone, where bears are expected to mount a strong defense again.
Conversely, if sellers successfully defend the 20-day EMA and the price turns down sharply from here, the support zone at $60,000 could be threatened. If this level breaks, the pair could plunge to $52,500.
Technical Analysis of ETH
Ether (ETH) rebounded from the $1,800 zone on Tuesday, showing that bulls are trying to keep the price within the $1,750 to $2,111 range.
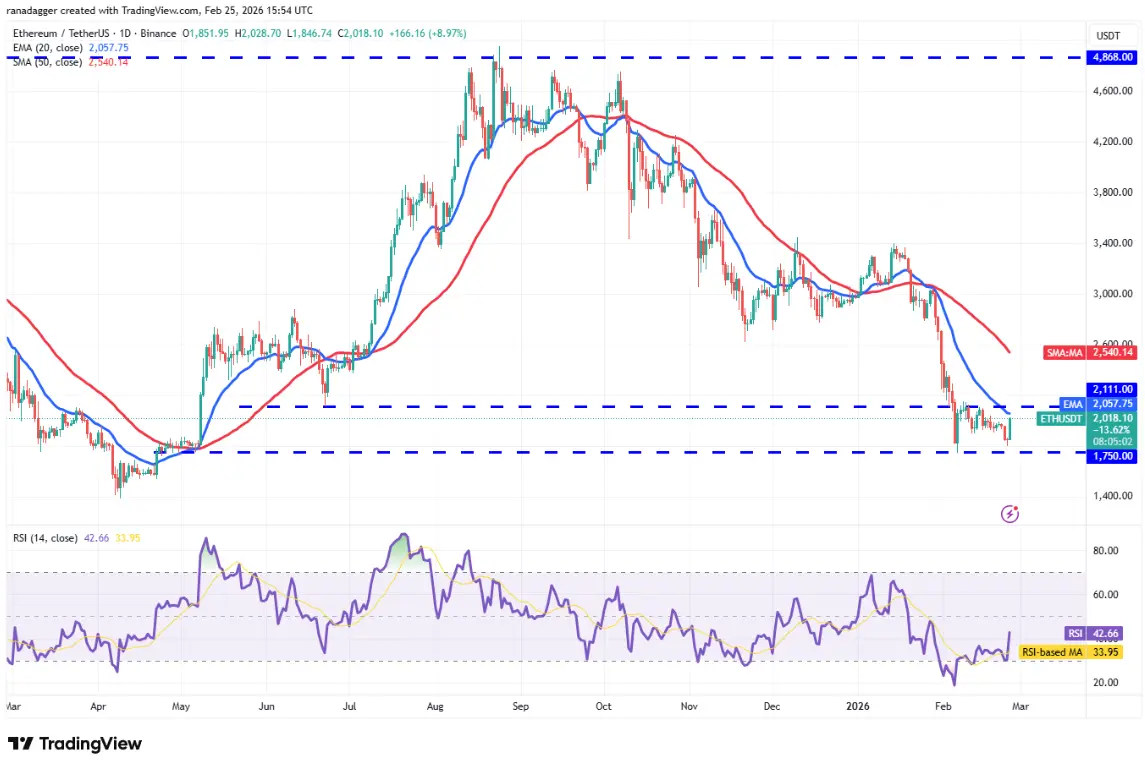 Daily ETH/USDT Chart | Source: TradingView The recovery is likely to face selling pressure at $2,111. If ETH’s price drops sharply from here, the ETH/USDT pair could continue to oscillate sideways for a few more days.
In a more positive scenario, if buyers push the price above $2,111, it indicates that bears are weakening. The pair could then rise to the 50-day simple moving average (SMA) at $2,540 — a level where bears are likely to re-enter.
Technical Analysis of XRP
XRP surged and reached the 20-day EMA at $1.46, indicating that bulls are attempting to regain control.
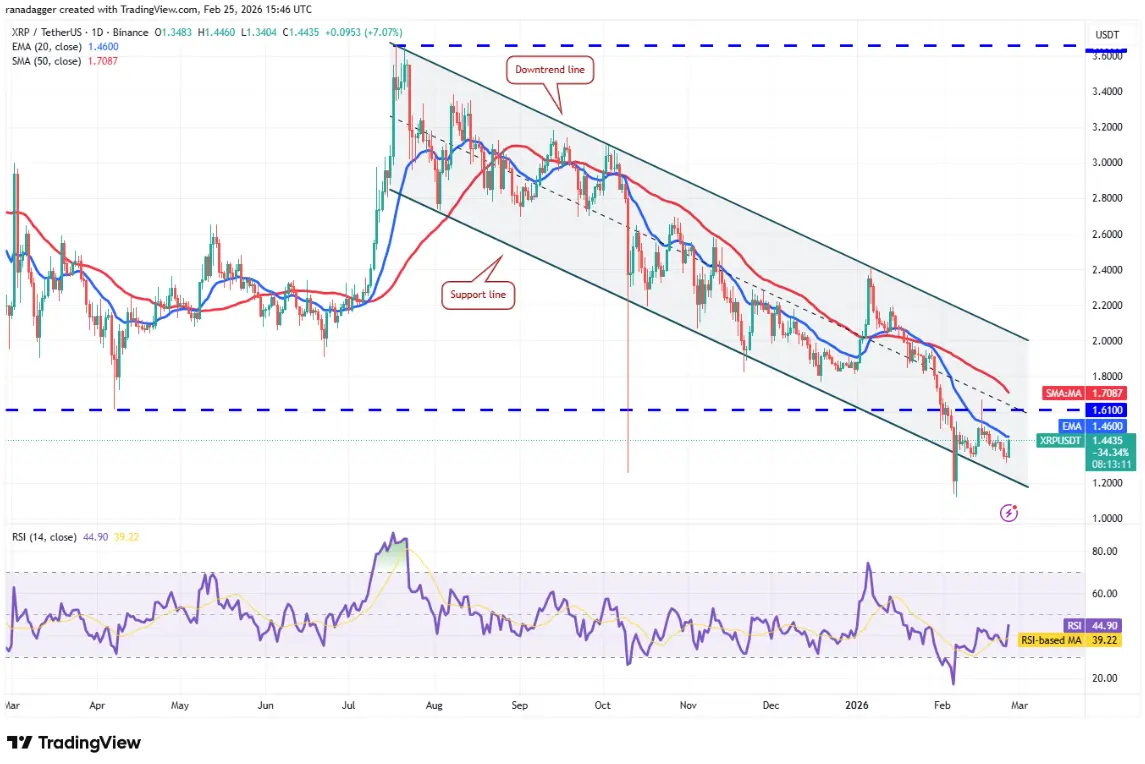 Daily XRP/USDT Chart | Source: TradingView If XRP closes above the 20-day EMA, the pair could rise to the 50-day SMA at $1.70 and then challenge the downward trendline. Buyers need to overcome this resistance to confirm a trend reversal.
However, bears are likely to defend the moving averages and push the price below support. If that happens, the pair could fall back to the February 6 low at $1.11, possibly even to $1.
Technical Analysis of BNB
BNB has risen sharply from $577, showing that bulls are defending the $570 zone aggressively.
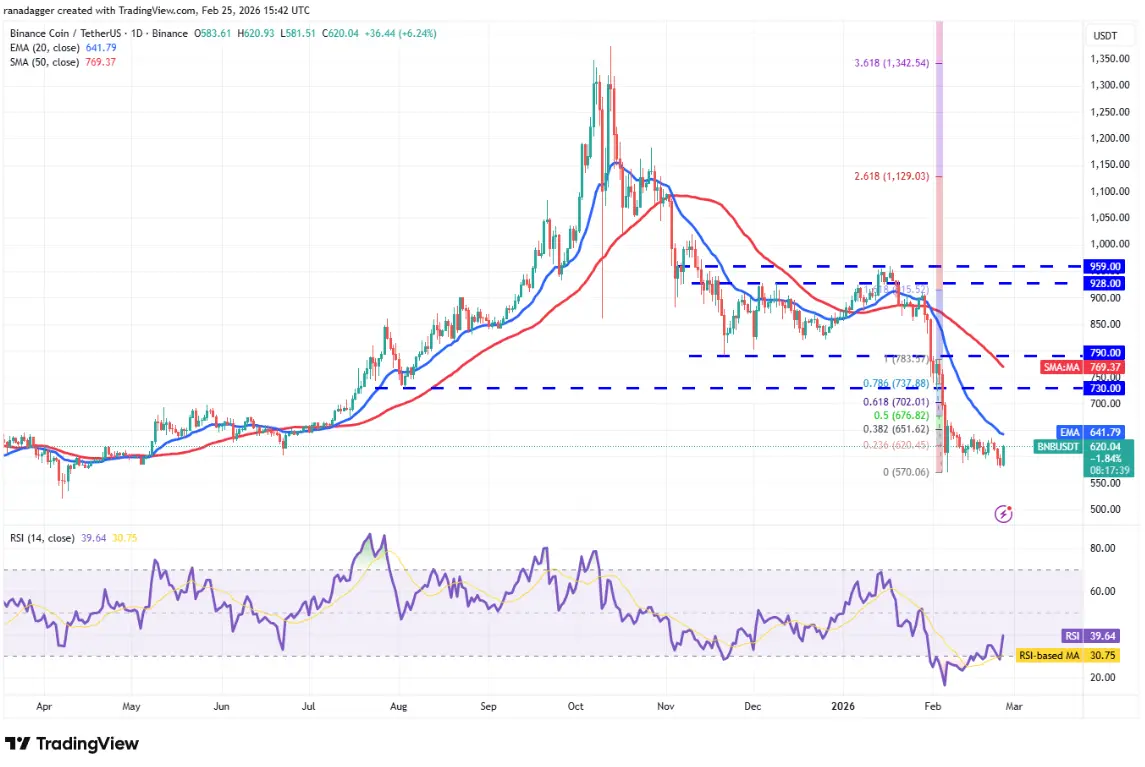 Daily BNB/USDT Chart | Source: TradingView Buyers need to quickly push the price above the 20-day EMA at $641 to strengthen their position. If successful, the BNB/USDT pair could climb to $669 and further to $730.
On the other hand, if BNB’s price turns down and breaks below $570, it indicates that bears are in control. The downward trend could then continue toward the psychological level of $500.
Technical Analysis of SOL
Solana (SOL) dropped below the support zone at $76 on Tuesday, but bears couldn’t sustain lower levels.
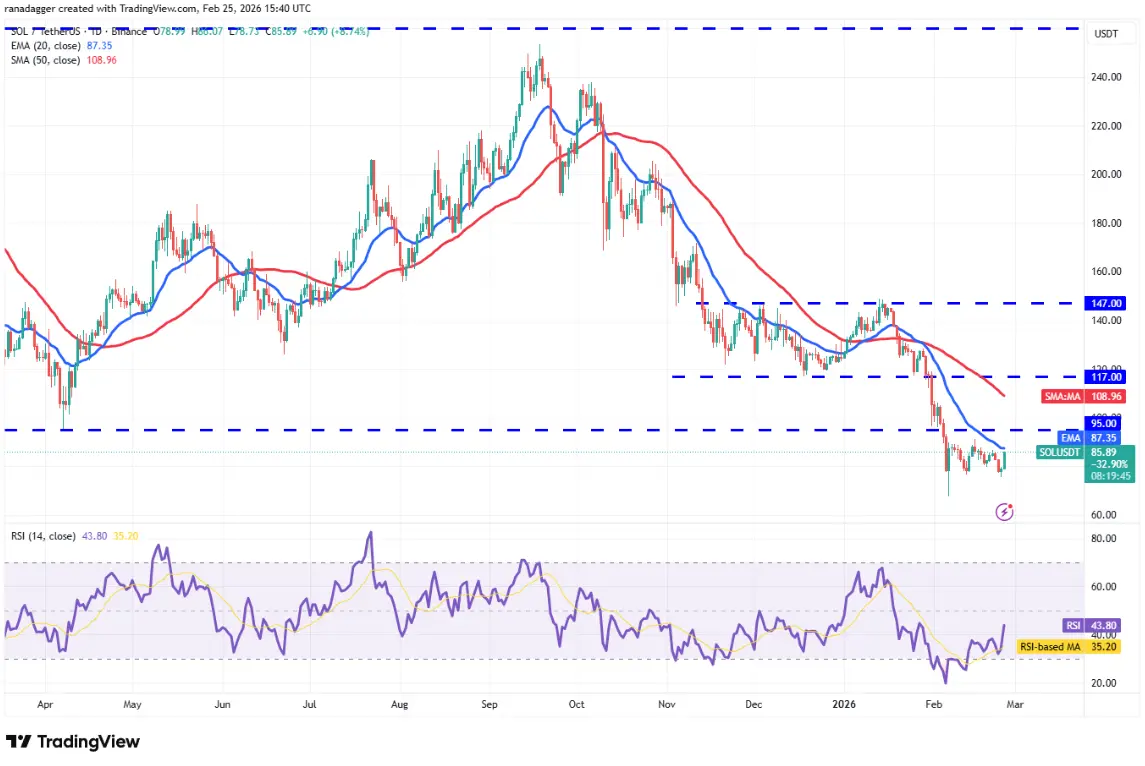 Daily SOL/USDT Chart | Source: TradingView The SOL/USDT pair is attempting to recover and may face selling pressure at the 20-day EMA at $87. If the price drops sharply from here, the risk of breaking below $76 increases. In that case, Solana could fall back to the February 6 low at $67.
Conversely, if bulls push the price above the 20-day EMA, the recovery could extend to $95. This is a critical level — a close above $95 would indicate bulls are regaining control. The pair could then rise to $117.
Technical Analysis of DOGE
Dogecoin (DOGE) surged from $0.09, and bulls are trying to push the price above the 20-day EMA at $0.10.
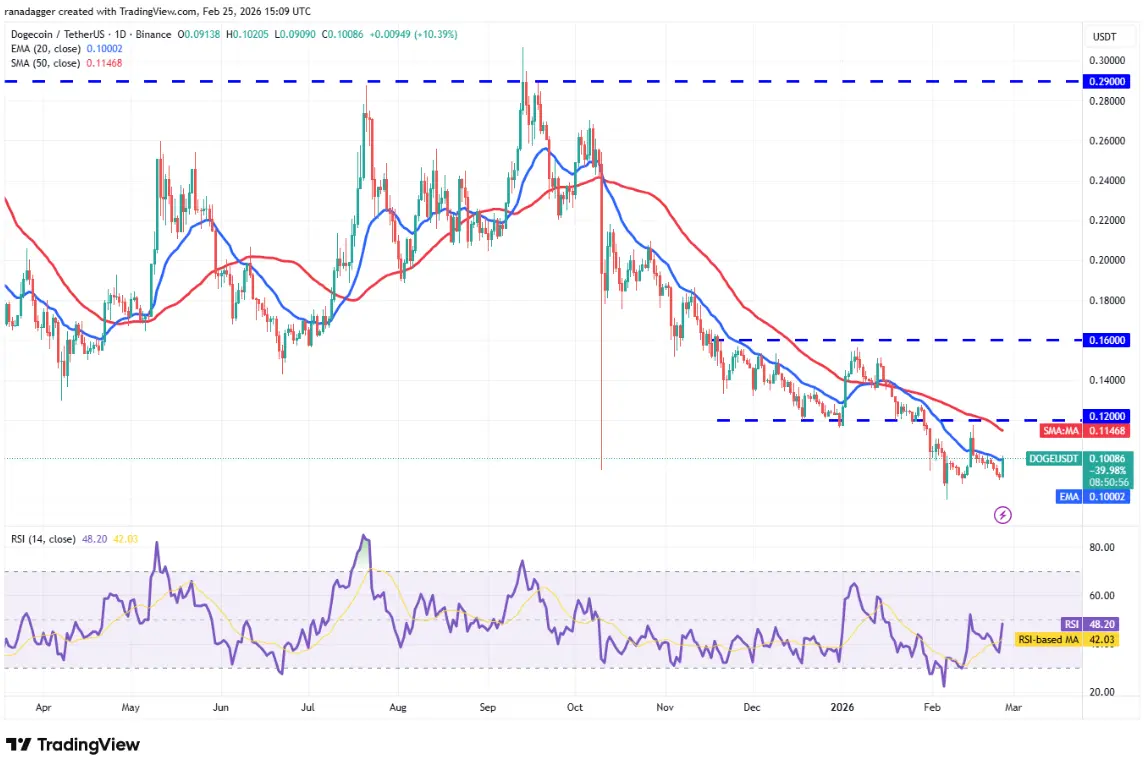 Daily DOGE/USDT Chart | Source: TradingView Bears will not give up easily and are likely to defend the 20-day EMA. If DOGE’s price turns down from here, it may fall back to the support zone at $0.08. Bulls are expected to strongly defend this level; a close below $0.08 could lead to a further decline toward $0.06.
Buyers need to keep the price above the 20-day EMA to show that bears are losing momentum. If successful, DOGE/USDT could move up toward the breakout level at $0.12.
Technical Analysis of BCH
Bitcoin Cash (BCH) dropped sharply from the 50-day SMA at $564 and fell below the support zone at $500 on Monday.
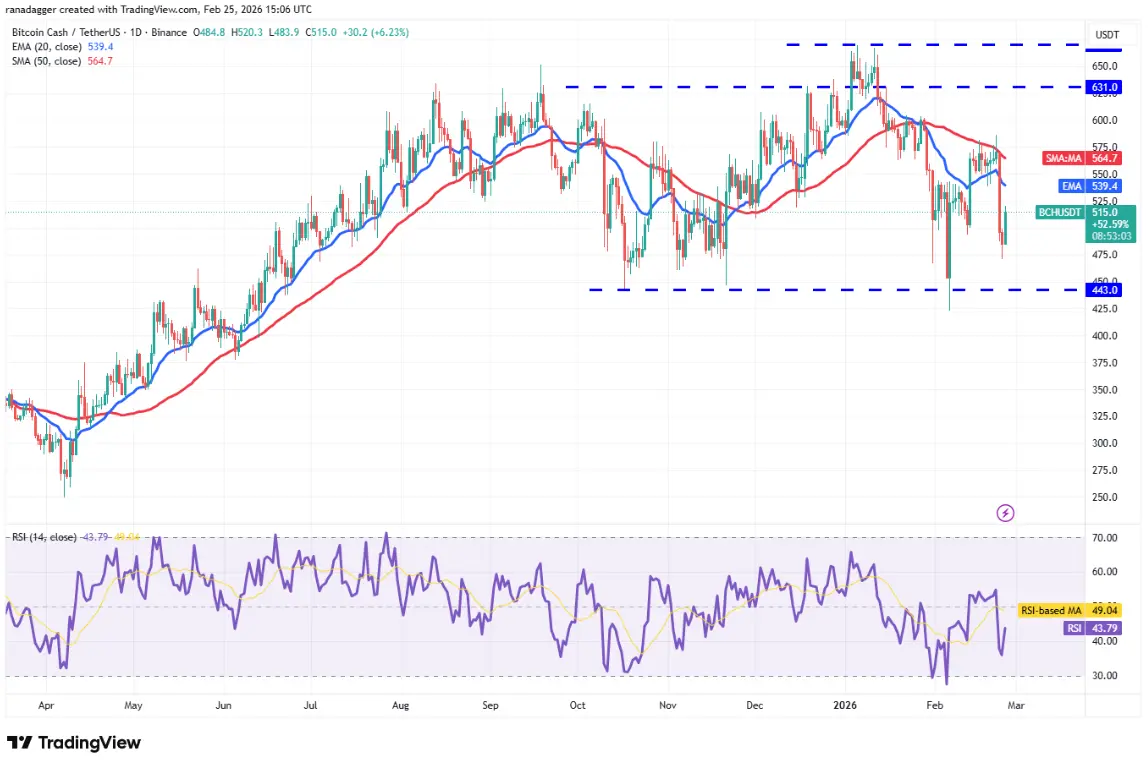 Daily BCH/USDT Chart | Source: TradingView The 20-day EMA has started to turn downward, and the relative strength index (RSI) is in the negative zone, indicating that bears are in control. This suggests that a recovery to the 20-day EMA will likely face selling pressure. If BCH’s price drops from the 20-day EMA, a fall to the $443 zone increases.
The first sign of strength would be a close above the moving averages. Then, BCH/USDT could rise to $580 and eventually to $600.
Technical Analysis of HYPE
Hyperliquid (HYPE) fell below the 50-day SMA at $28.10 on Monday, indicating that bears are trying to take control.
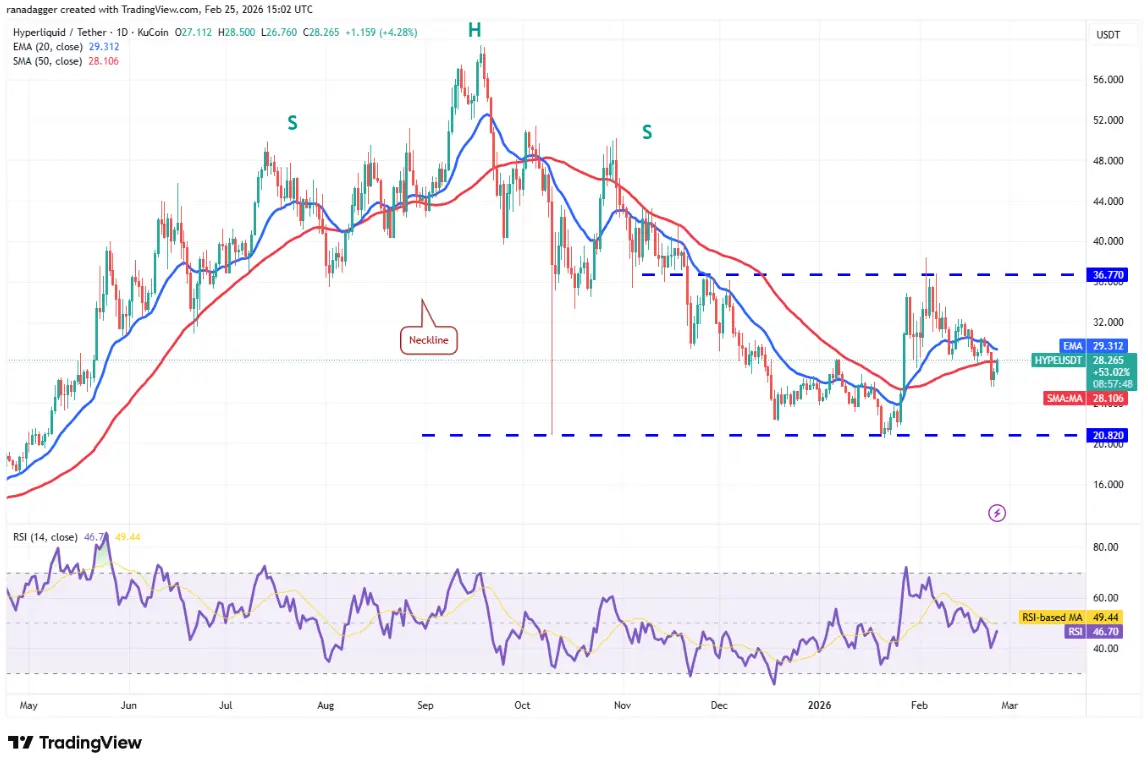 Daily HYPE/USDT Chart | Source: TradingView Buyers are attempting to push the price back above the moving averages but are likely to face strong resistance from bears. If HYPE’s price turns down from these levels, it could fall to the strong support at $20.82.
Alternatively, a close above the 20-day EMA at $29.31 would show renewed buying interest at lower levels. The pair could then rise to $32.50 and further to the strong resistance zone at $36.77. The next trend could begin once the price closes above $36.77 or below $20.82.
Technical Analysis of ADA
The bears failed to push Cardano (ADA) down the descending channel support line, indicating that selling pressure at lower levels is not strong.
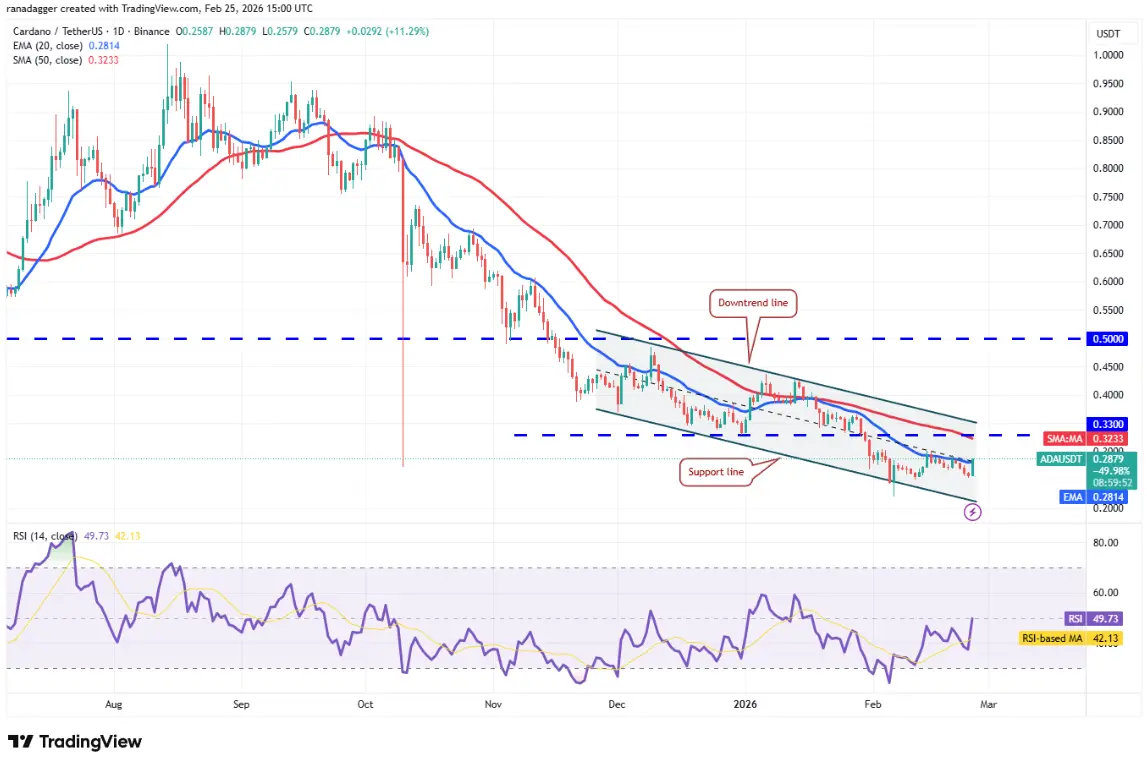 Daily ADA/USDT Chart | Source: TradingView Bulls are trying to regain control by holding ADA above the 20-day EMA at $0.28. If successful, ADA/USDT could rise to the descending trendline.
If the price sharply reverses from the trendline and breaks below the 20-day EMA, it suggests the pair may continue to oscillate within the channel for some time. Bulls will need to close above the trendline to regain an advantage.
Technical Analysis of XMR
Monero (XMR) fell below the nearest support zone at $309 on Monday, but bears couldn’t sustain lower levels.
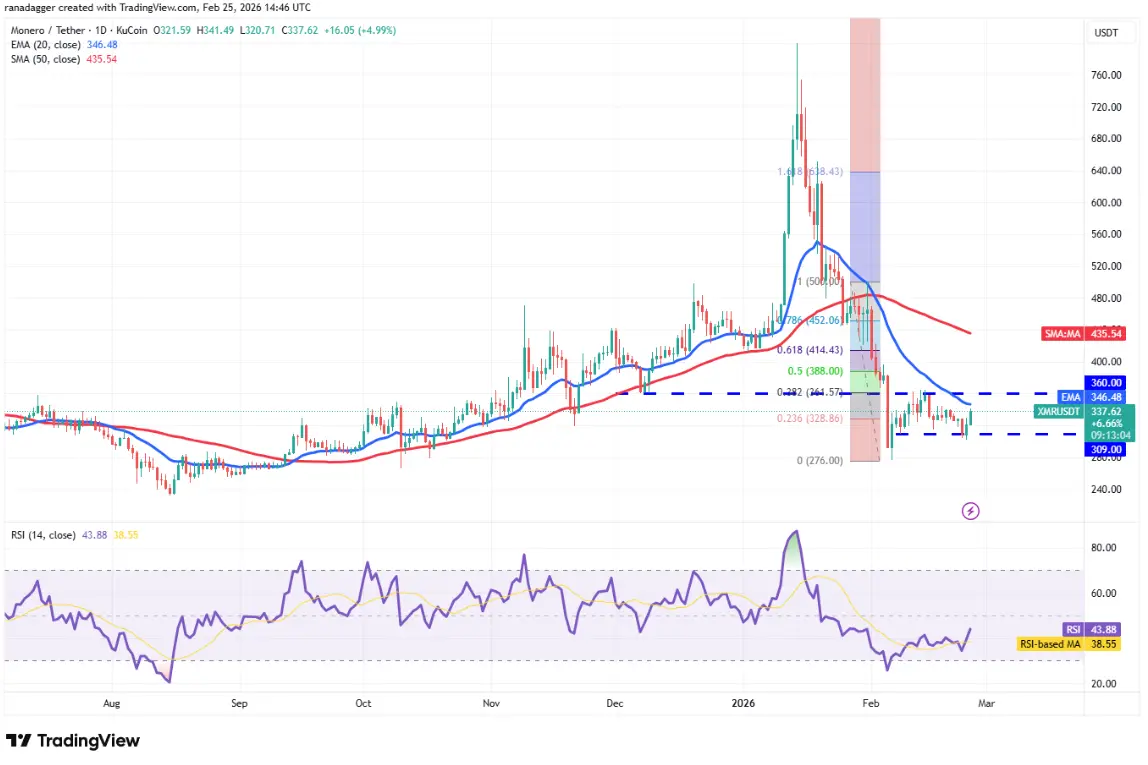 Daily XMR/USDT Chart | Source: TradingView Bulls are attempting a recovery but are likely to face selling pressure at the 20-day EMA at $346 and then at the previous breakout zone at $360. If Monero’s price reverses downward from this resistance, it could trade sideways between $300 and $360 for a while.
The advantage would tilt toward bulls if they can push and hold XMR/USDT above $360. If successful, the pair could rise sharply toward the 50-day SMA at $435.
