Hedera (HBAR) price continues to decline in a bearish trend as it extends its downward move and trades below the $0.103 level at the time of writing on Tuesday, after losing nearly 4% in the previous session. On-chain indicators and derivatives markets are both showing negative signals, combined with technical indicators that are not very optimistic, reinforcing a bearish scenario and increasing the risk of HBAR entering a deeper correction in the near future.
On-chain and derivatives data indicate a downtrend
Social Dominance data from Santiment further supports a negative outlook for Hedera. This index reflects the proportion of discussions related to HBAR across crypto media. Since late December, Social Dominance has been in a clear declining trend and continued to fall sharply in February, reaching just 0.018% on Tuesday. This movement indicates waning market interest and reflects increasingly negative investor sentiment toward HBAR.
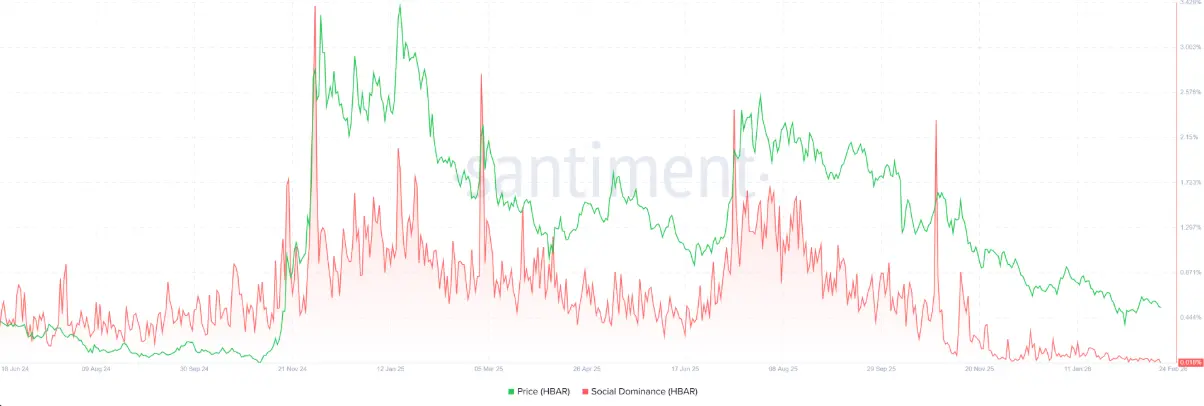 HBAR Social Dominance Chart | Source: Santiment
In the derivatives market, Hedera futures open interest (OI) also looks bleak, dropping to $92.15 million on Tuesday. The downward trend has been ongoing since early January, and OI is approaching the February 6 low of $88.89 million. The continuous contraction of OI suggests weakening capital flow and investor participation, highlighting a short-term bearish outlook.
HBAR Social Dominance Chart | Source: Santiment
In the derivatives market, Hedera futures open interest (OI) also looks bleak, dropping to $92.15 million on Tuesday. The downward trend has been ongoing since early January, and OI is approaching the February 6 low of $88.89 million. The continuous contraction of OI suggests weakening capital flow and investor participation, highlighting a short-term bearish outlook.
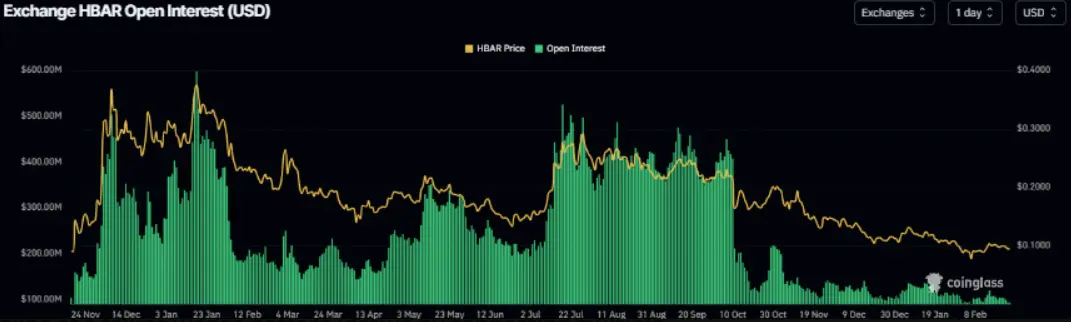 HBAR Open Interest Chart | Source: Coinglass
Hedera Price Forecast: Bears Target Deeper Correction
Hedera’s price failed to break above the 50-day exponential moving average (EMA) at $0.103 on February 14, leading to a sharp decline of about 8.5% through Monday. Notably, the 50-day EMA nearly coincides with the upper trendline of a falling wedge pattern — formed by connecting the highs and lows since late June — making this area a key technical resistance. As of Tuesday, HBAR is trading around $0.094.
If selling pressure persists, HBAR could retreat to a critical support zone on the weekly timeframe at $0.090. Closing below this level could trigger a new wave of selling, pushing the price further down to the next daily support around $0.072 — the low established on October 10.
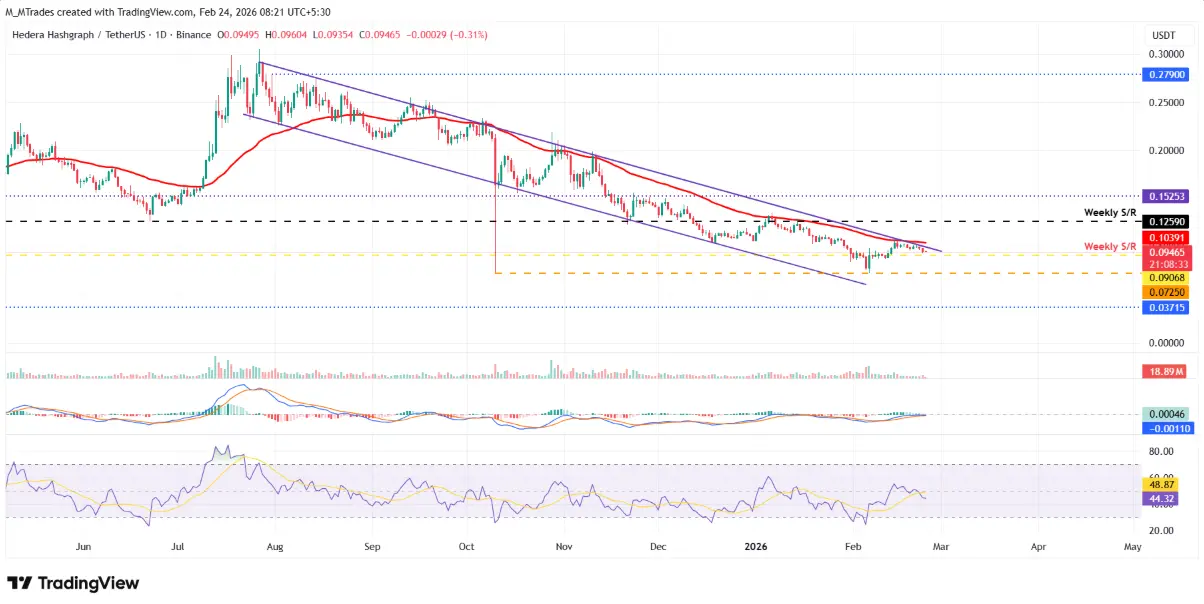 Daily HBAR/USDT Chart | Source: TradingView
Momentum indicators also lean toward a negative scenario. The Relative Strength Index (RSI) on the daily chart is at 44, below the neutral 50 level, and continues to weaken, indicating that the bearish momentum is gaining strength. Meanwhile, MACD lines are converging, suggesting market indecision. A bearish crossover in MACD would further confirm the short-term downside outlook.
Daily HBAR/USDT Chart | Source: TradingView
Momentum indicators also lean toward a negative scenario. The Relative Strength Index (RSI) on the daily chart is at 44, below the neutral 50 level, and continues to weaken, indicating that the bearish momentum is gaining strength. Meanwhile, MACD lines are converging, suggesting market indecision. A bearish crossover in MACD would further confirm the short-term downside outlook.
In a more optimistic scenario, if buying interest returns and HBAR recovers, the price could regain upward momentum and test the 50-day EMA at around $0.103 — a key resistance level that must be broken to reverse the trend.
Disclaimer: The information on this page may come from third parties and does not represent the views or opinions of Gate. The content displayed on this page is for reference only and does not constitute any financial, investment, or legal advice. Gate does not guarantee the accuracy or completeness of the information and shall not be liable for any losses arising from the use of this information. Virtual asset investments carry high risks and are subject to significant price volatility. You may lose all of your invested principal. Please fully understand the relevant risks and make prudent decisions based on your own financial situation and risk tolerance. For details, please refer to
Disclaimer.
Related Articles
Bitcoin Rebounds to $74K on U.S.-Iran Framework Deal, But Market Skepticism Remains
Bitcoin's recent rise to mid-$74,000 followed a risk asset rally linked to a U.S.-Iran nuclear framework, but skepticism remains due to flat Treasury yields and unchanged gold prices. The core issue of uranium enrichment persists, and while on-chain data shows BTC's gradual advance, options markets reflect doubts about a sustained breakout. Overall, analysts see the rally as temporary, with macro conditions still tight and potential downside risks.
GateNews9h ago
Cardano Traders Watch $0.243 Support Level as ADA Price Faces Critical Decision
Cardano (ADA) is at a crucial support level of $0.243, with potential gains to $0.30 if it holds. A daily close below this could lead to declines toward $0.10. Currently, trading volume is around $500 million, with ADA notably below its all-time high.
GateNews11h ago
ETH/BTC Price Ratio Rebounds to 0.0313 in Q1 2026 as Ethereum User Base Surges 82%
In Q1 2026, the Ethereum-to-Bitcoin price ratio reached a three-month high at 0.0313. Ethereum added 284,000 users and surpassed $180 billion in stablecoin supply. Bitcoin remained strong above $74,000, driven by significant ETF inflows.
GateNews16h ago
Why is Bitcoin up today? Trump says Iran is seeking a truce, and risk assets move higher across the board
On April 15, Bitcoin rebounded about 6% after Trump said Iran is seeking to reach an agreement, breaking above $75,000. Expectations for the resumption of U.S.-Iran negotiations warmed up, lifting Asian stock markets. Technically, roughly $6 billion worth of short positions were forced to close, accelerating the rebound. Analysts said that if the U.S.-Iran situation continues to ease, Bitcoin could break through $80,000, and they predicted it may reach $150,000 by year-end.
MarketWhisper20h ago
Bitmine is promoted to the NYSE main board! Tom Lee: US stocks may be at a bottom, and selling pressure on Ether could ease
Bitmine officially transferred from the NYSE American market to the main board, marking a significant milestone for the company. Despite a sharp drop in its share price, it still increased the share repurchase program to $4 billion. The company holds a large amount of Ether, and expects that a rebound in the crypto market will help improve its assets and share price performance.
CryptoCity20h ago
ETH 15-minute up 0.66%: On-chain large transfers in sync drove a net inflow of funds, boosting spot buying pressure
2026-04-15 00:00 to 00:15 (UTC), ETH shows a local anomaly. The 15-minute return rate is +0.66%. The trading price range is 2321.93–2343.2 USDT, with a range of 0.92%. During this period, market attention increased, volatility slightly intensified, buy pressure in the order book shifted upward in the short term, and quickly pushed spot prices up into a key resistance area.
The main drivers of this anomaly are large on-chain transfers and inflows of capital in combination. At the beginning of the window, multiple large ETH transfers appeared, including 8,676 ETH and 6,551 ETH, respectively, transferring from a large source to the
GateNews20h ago
