Injective (INJ) trades near $3 after 76% yearly drop, testing key support as RSI signals oversold conditions.
Injective (INJ) is trading near $3.27 on the weekly chart, following an extended decline from its 2024 highs above $40.
Market data shows the asset remains under pressure, while technical indicators suggest oversold conditions.
Weekly Price Structure Remains Bearish
The weekly INJ/USDT chart shows a clear pattern of lower highs and lower lows since early 2024.
A major top formed above $40, and price has trended downward since then. The broader structure remains bearish.
Price is now testing the $3.00 level, which serves as a psychological and recent reaction zone.
Below that, support levels are seen near $2.50 and $2.00. These areas previously acted as consolidation bases.
On the upside, resistance is visible near $5.00, followed by $8.00 to $10.00. A weekly close above $5 would mark the first structural improvement. Until then, the trend remains intact.
RSI and MACD Show Oversold Conditions
The weekly Relative Strength Index is near 29 to 32. This places INJ in oversold territory. However, during strong downtrends, RSI can remain low for extended periods.
A move above 40 on the weekly RSI would signal improving momentum. At present, no confirmed bullish divergence is visible. Price continues to respect the broader downward structure.
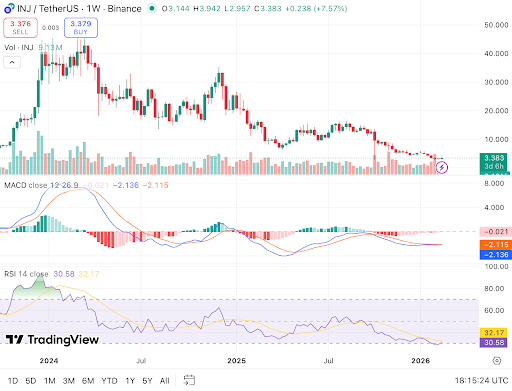
INJ tests critical $3 support amid persistent bearish momentum. Source: TradingView
The MACD indicator remains below the zero line. The histogram shows weakening bearish momentum, but no bullish crossover has formed.
This suggests downside pressure may be slowing, though confirmation is absent.
**Related Reading: **Bullish: New Injective Governance Vote Could Slash $INJ Supply By Half
Volume, Performance Metrics and DeFi Context
Trading volume has declined during the downtrend. There is no visible accumulation spike on the weekly chart.
A sustained reversal would require a strong green candle with higher volume.
Performance data shows short-term gains but longer-term weakness. INJ is up 4.30% over 24 hours and 6.70% over seven days.
However, it remains down 33.77% over 30 days and 76.94% over one year.
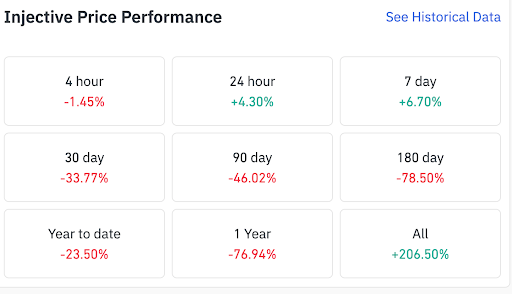
INJ shows mixed timeframes with short-term gains but deep longer-term drawdowns – Source: Coinglass data.
INJ shows mixed timeframes with short-term gains but deep longer-term drawdowns — Source: Coinglass data.
Total Value Locked across DeFi stands near $94.3 billion, down 1.79% in 24 hours. This remains below the 2021 peak near $180 billion, yet above 2022 lows.
While DeFi capital has stabilized, INJ price action has not confirmed accumulation.
Injective now trades at a critical level near $3.00. A sustained defense could lead to range formation between $3 and $5.
A breakdown below support may expose lower historical zones near $2.50 and $2.00.
Disclaimer: The information on this page may come from third parties and does not represent the views or opinions of Gate. The content displayed on this page is for reference only and does not constitute any financial, investment, or legal advice. Gate does not guarantee the accuracy or completeness of the information and shall not be liable for any losses arising from the use of this information. Virtual asset investments carry high risks and are subject to significant price volatility. You may lose all of your invested principal. Please fully understand the relevant risks and make prudent decisions based on your own financial situation and risk tolerance. For details, please refer to
Disclaimer.
Related Articles
XRP Today News: Leverage Ratio Drops 78% Sharply, On-Chain Transaction Volume Hits a New Annual High
XRP derivatives market leverage drops to its lowest level in nearly nine months, indicating that the market overheating pressure is easing. At the same time, XRPL’s weekly transaction volume reaches 19 million, driven by Ripple’s business progress and new partnerships. However, the technical risk XRP faces lies in its head-and-shoulders top pattern; the key support level is between $1.37 and $1.40, and a break below could lead to a pullback.
MarketWhisper30m ago
The price of HYPE is facing a risk of a 37% decrease as capital flow turns negative.
Hyperliquid (HYPE) is currently trading around $39, down 2.79%, with a double top formation indicating potential decline. A significant short liquidation zone at $42 acts as resistance, while dwindling CMF shows a shift to negative cash flow, suggesting a possible drop to $21 unless the price exceeds $42.
TapChiBitcoin59m ago
Crypto Fear Index rises to 13, market "fear" sentiment slightly eases
BlockBeats News, March 27 — According to Alternative data, today’s cryptocurrency Fear and Greed Index is 13 (yesterday was 10), indicating a slight easing of market "fear" sentiment.
Note: The Fear and Greed Index threshold is 0-100, including indicators: volatility (25%), market trading volume (25%), social media buzz (15%), market surveys (15%), Bitcoin’s proportion in the overall market (10%), and Google trending searches analysis (10%).
BlockBeatNews1h ago
Peter Brandt: Bitcoin shows a sell signal
Renowned trader Peter Brandt posted a chart indicating that Bitcoin's price is forming an ascending wedge pattern, suggesting a possible decline. The current price is in the $65,000-$70,000 range, and Brandt previously accurately predicted a short-term rebound for Bitcoin.
BlockBeatNews1h ago
The current mainstream CEX and DEX funding rates indicate that the market bearish sentiment has weakened.
According to BlockBeats, Bitcoin prices have slightly declined, and the funding rates on major exchanges indicate a weakening of the bearish market sentiment. The funding rate is a mechanism that adjusts the difference between the contract price and the underlying asset price.
BlockBeatNews1h ago
