
Bitcoin is trading around $68K right now, but a CryptoQuant chart making the rounds is putting a much lower number back on the table: $39K. The logic comes from one of the most watched on-chain “line in the sand” metrics in crypto cycles — realized price.
- What the BTC chart is showing
- What “realized price” means in plain English
- How realistic is $55K… and the $39K flush?
- The levels that matter from here
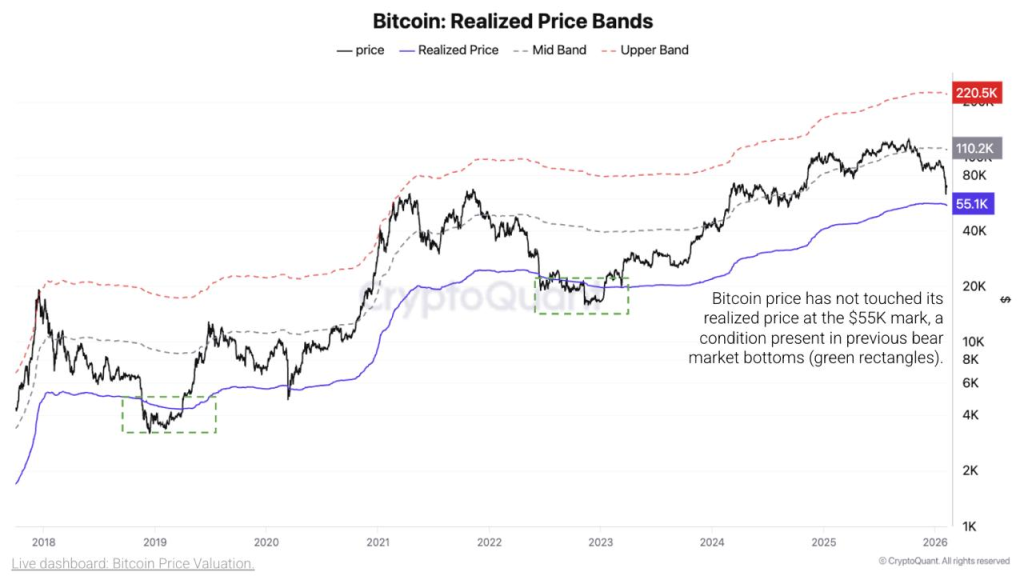
What the BTC chart is showing
The chart plots Bitcoin’s market price (black) against realized price (blue), plus a set of bands above it. On the right side, the realized price level sits near $55.1K.
The key observation: in prior bear market bottoms, Bitcoin didn’t bottom until price came down to realized price (the green-highlighted zones on older cycles). In the current cycle, price has not tagged that realized-price line yet.
Those dashed bands matter for context, too. They act like valuation zones across cycles:
- The realized price acts like a “cost basis anchor” for the market.
- The higher bands map out hotter valuation zones that usually show up in full-risk-on phases.
Source: X/@coinbureau
What “realized price” means in plain English
Realized price is basically Bitcoin’s average** on-chain cost basis**: it values each coin at the last price it moved on-chain, then averages that across the supply. Put simply, it estimates what the market, as a whole, paid for its BTC.
Why traders care: when Bitcoin trades above realized price, the average holder is in profit. When it trades at or below realized price, the market is under stress and capitulation dynamics show up more often.
It’s not a magic bottom button, but it’s one of the cleaner “where does pain peak” gauges that tends to matter most during deep drawdowns.
How realistic is $55K… and the $39K flush?
From $68K to $55K is a drop of about 19%. That’s completely plausible in crypto terms, especially during a volatility spike or a broader risk-off move.
The more extreme number comes from the historical note baked into the post: in past cycles, Bitcoin pushed 24–30% below it before the final low printed.
If realized price is ~$55K:
- 24% below is about $41.8K
- 30% below is about $38.5K
That’s where the $39K headline comes from. It’s basically a “full capitulation” scenario where the market overshoots the average cost basis before stabilizing.
The reality check: a drop to $39K would require a much more aggressive unwind than a normal pullback. It would likely need a sharp liquidity event, a macro shock, or a broad deleveraging wave that forces sellers to dump into a thin bid.
Read also: AI is Coming For Your Stocks – Here’s What You Need to Know
The levels that matter from here
If this realized-price framework is the lens, then the map is straightforward:
- $68K (current area): market still holding above the “pain line,” but not far enough to dismiss a deeper reset.
- $60K: a psychological and structural zone that tends to get defended first.
- $55K (realized price): the key level CryptoQuant is flagging as the classic bear-market bottom condition.
- $42K–$39K: the “overshoot” zone if panic selling drives a final flush below realized price.
If Bitcoin holds above the low $60Ks and keeps bouncing, the realized-price tag may never happen this cycle. If momentum breaks and $60K fails decisively, realized price becomes the next major magnet.
Bottom line: $55K is the realistic stress-test level. $39K is the capitulation tail-risk level that becomes relevant only if the market gets forced into a hard reset.
Read also: Bitcoin at $60K Could Be the Deal of the Decade
Disclaimer: The information on this page may come from third parties and does not represent the views or opinions of Gate. The content displayed on this page is for reference only and does not constitute any financial, investment, or legal advice. Gate does not guarantee the accuracy or completeness of the information and shall not be liable for any losses arising from the use of this information. Virtual asset investments carry high risks and are subject to significant price volatility. You may lose all of your invested principal. Please fully understand the relevant risks and make prudent decisions based on your own financial situation and risk tolerance. For details, please refer to
Disclaimer.
Related Articles
Bitcoin, ether, solana hold steady as Trump sets Tuesday night deadline for Iran deal
Bitcoin dipped to $68,589 after a brief rally fueled by ceasefire news, as geopolitical tensions persist. Other cryptocurrencies also fell. Market uncertainty continues, with Bitcoin trading within the $65,000 to $73,000 range, awaiting Trump's deadline for Iran negotiations.
CoinDesk11m ago
Bitcoin spot ETF saw net inflows of $471 million yesterday, with BlackRock’s IBIT leading the way at $182 million in inflows in a single day
On April 6, Bitcoin spot ETF net inflows reached $471 million, including a single-day net inflow of $182 million for the BlackRock ETF and a net inflow of $147 million for the Fidelity ETF. Bitcoin spot ETF total net assets were $90.26B, with cumulative net inflows of $56.43B.
GateNews22m ago
Bitcoin is hovering around the $68,000 threshold, and the risk of further downside is increasing as whales sell and demand remains weak.
Gate News: Bitcoin’s price has fallen to around $68,000. It had repeatedly failed to break through the $70,000 level, and market momentum has clearly weakened. The current price is still within the $65,000 to $73,000 trading range, but the risk of testing the lower end of the range is rising.
GateNews48m ago
The SEC will roll out new rules to “regulate cryptocurrencies”: defining what counts as fundraising and what falls under securities; it has already been submitted to the White House
The U.S. Securities and Exchange Commission (SEC) is set to roll out new rules for “regulating cryptocurrencies” to完善 the crypto asset regulatory framework and clarify whether trading constitutes a security. The rule is based on the 1933 Securities Act and may affect compliance pathways for mainstream assets, aiming to balance protecting investors with encouraging innovation.
GateNews50m ago
Santiment Alert: BTC profit-loss ratio hits 2.95, the top signal is approaching
Based on Santiment data, Bitcoin’s profit-to-loss trade ratio has reached 2.95:1, nearing the historical alert level of 3.0, which may signal a short-term price top. A high profit-to-loss ratio also reflects optimistic market sentiment, but it can also build up selling pressure. Historical cases show that a profit-to-loss ratio near 3.0 does not necessarily lead to a pullback; the market needs to combine multiple indicators for a comprehensive analysis.
MarketWhisper1h ago
A whale moved 300 BTC to a certain CEX about half an hour ago, incurring a loss of roughly $8.82 million
Gate News message, April 7, according to crypto analyst Yu Jin, a whale address transferred 300 BTC into a certain CEX about half an hour ago, worth approximately $20.6 million. That address previously, from January to March last year, bought a total of 510 BTC through a certain CEX at an average price of about $98,190, for a total cost of approximately $50.07 million. The 300 BTC transferred out this time corresponds to realized losses of approximately $8.82 million.
GateNews1h ago
