![]() Trusted Editorial content, reviewed by leading industry experts and seasoned editors. Ad Disclosure
The current market landscape for Bitcoin remains largely bearish following a net 2.41% loss over the past week. While Bitcoin is presently stabilizing around $68,000, the digital asset remains about 46% off its all-time high ($126,100) recorded in late 2025.
Trusted Editorial content, reviewed by leading industry experts and seasoned editors. Ad Disclosure
The current market landscape for Bitcoin remains largely bearish following a net 2.41% loss over the past week. While Bitcoin is presently stabilizing around $68,000, the digital asset remains about 46% off its all-time high ($126,100) recorded in late 2025.
Related Reading: The Cycle Without A Ceiling: Why Bitcoin’s Missing Peak Rewrites The Rules For The 2026 Bottom## Bull Or Bear? Decoding Bitcoin’s SSR Liquidity Signals
In a QuickTake post on the CryptoQuant platform, a pseudonymous analyst, MorenoDV, explained how the Stablecoin Supply Ratio (SSR) acts as a liquidity signal for Bitcoin and why the current level around 9.5–9.6 is important.
SSR measures Bitcoin’s market cap relative to stablecoin supply. In other words, it reflects how much “dry powder“ (buying power) exists in the market. High SSR shows that Bitcoin’s market cap is large relative to stablecoins – less sidelined buying power, while Low SSR indicates stablecoin supply relatively strong to Bitcoin — more potential buying power available.
![Bitcoin]() Source: CryptoQuantAccording to analyst MorenoDV, the SSR is not a straightforward bullish or bearish indicator; its significance depends on the direction of the market’s approach to the 9.5 level. When the SSR falls towards 9.5 from higher levels, it typically signals strengthening stablecoin liquidity, which has often led to Bitcoin finding support or reversing upward in past cycles.
Source: CryptoQuantAccording to analyst MorenoDV, the SSR is not a straightforward bullish or bearish indicator; its significance depends on the direction of the market’s approach to the 9.5 level. When the SSR falls towards 9.5 from higher levels, it typically signals strengthening stablecoin liquidity, which has often led to Bitcoin finding support or reversing upward in past cycles.
Conversely, if the SSR rises toward 9.5 from lower levels, it suggests fading liquidity, historically preceding local tops and short-term corrections.
Analyst MorenoDV describes the 9.5 level as a liquidity equilibrium zone due to its ability to act as support or resistance based on the market approach. As the SSR navigates this critical zone, market traders will closely observe if stablecoin inflows are maintained at a constant level, or if there is an impending liquidity exhaustion, which would be indicated by a rejection at this equilibrium zone.
Related Reading: US Treasury Secretary Urges Congress To Pass Crypto Market Structure Bill This Spring## Bitcoin Price Overview
As of writing, Bitcoin’s price stands at ~$68,840, reflecting a 3.97% increase over the past 24 hours. Meanwhile, its daily trading volume is down by 15.3% and valued at $37.33 billion. According to data from Coincodex, the Fear and Greed index stands at 9, indicating extreme levels of caution among investors.
However, Coincodex analysts and investors will gradually adopt a more bullish stance, as their projections hint at a $73,769 target in five days and $77,687 in a month. Meanwhile, a three-month target of $72,480, suggest some levels retracement following the initial surge, in line with a classic ascending pattern.
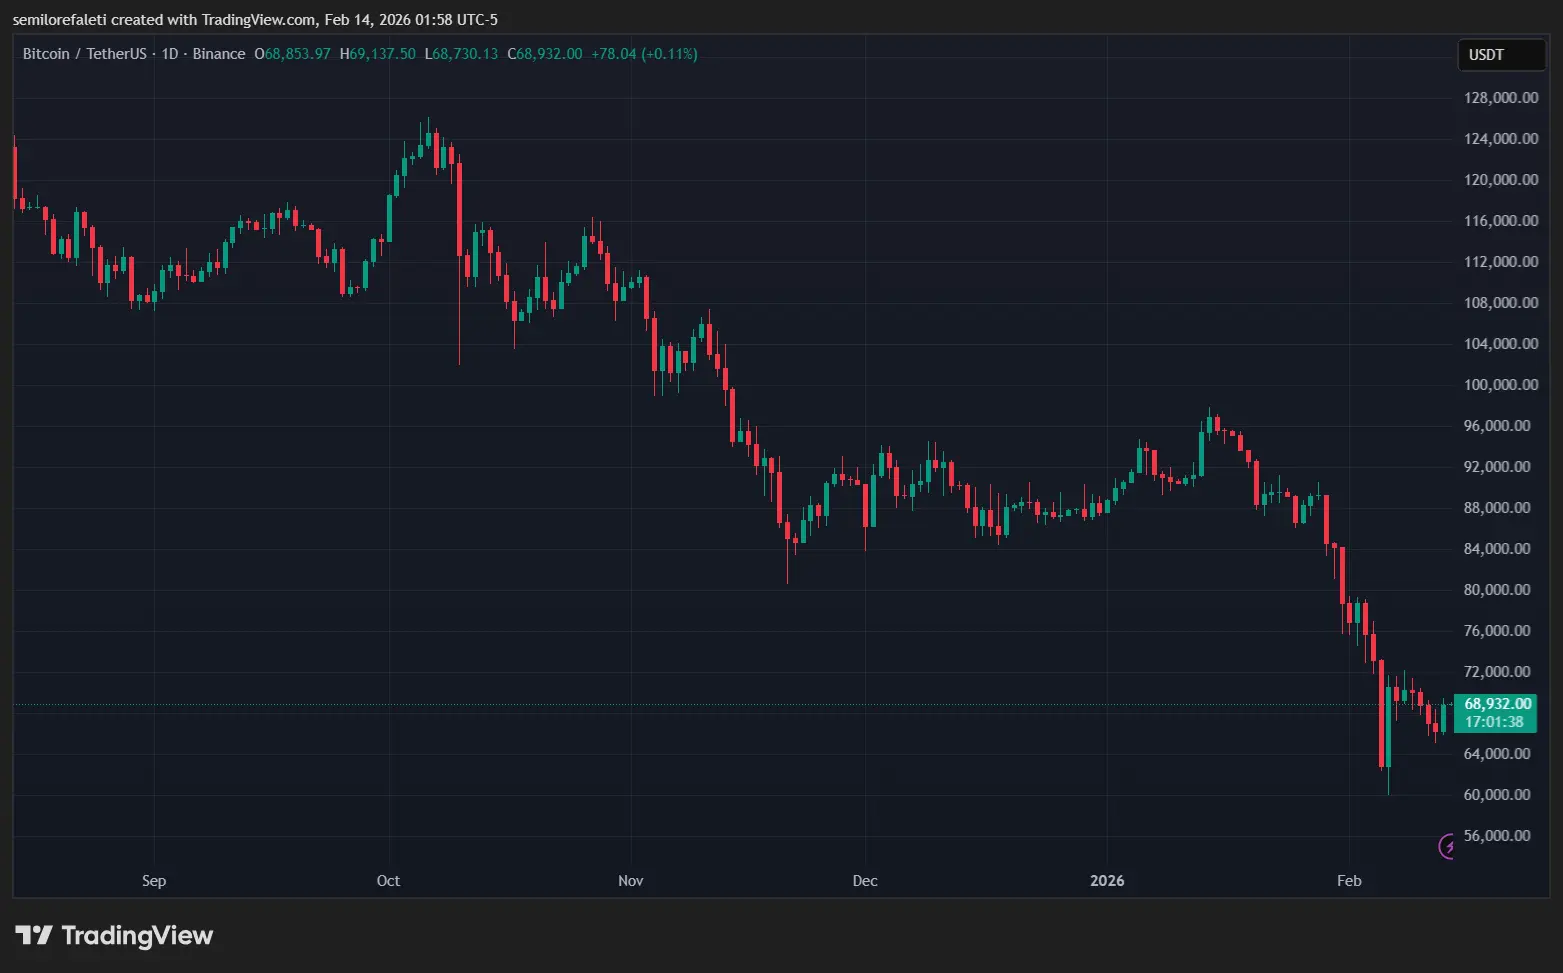 BTC trading at $68,932 on the daily chart | Source: BTCUSDT chart on Tradingview.comFeatured image from XVerse, chart from Tradingview.com
![]() Editorial Process for bitcoinist is centered on delivering thoroughly researched, accurate, and unbiased content. We uphold strict sourcing standards, and each page undergoes diligent review by our team of top technology experts and seasoned editors. This process ensures the integrity, relevance, and value of our content for our readers.
Editorial Process for bitcoinist is centered on delivering thoroughly researched, accurate, and unbiased content. We uphold strict sourcing standards, and each page undergoes diligent review by our team of top technology experts and seasoned editors. This process ensures the integrity, relevance, and value of our content for our readers.
Disclaimer: The information on this page may come from third parties and does not represent the views or opinions of Gate. The content displayed on this page is for reference only and does not constitute any financial, investment, or legal advice. Gate does not guarantee the accuracy or completeness of the information and shall not be liable for any losses arising from the use of this information. Virtual asset investments carry high risks and are subject to significant price volatility. You may lose all of your invested principal. Please fully understand the relevant risks and make prudent decisions based on your own financial situation and risk tolerance. For details, please refer to
Disclaimer.
Related Articles
BTC drops 0.62% over 15 minutes: exchange net inflows intensify and short-term arbitrage converges to trigger volatility
From 18:00 to 18:15 on April 9, 2026 (UTC), the BTC price return recorded -0.62%, closing in the range of 71857.8 to 72375.1 USDT, with a trading range of 0.72%. Market attention was notably elevated, volatility intensified, and capital moved quickly within a short period. Overall market sentiment has become more cautious, and investors’ willingness to trade in the short term has increased.
The main driving force behind this abnormal move is an increase in net inflows to BTC exchanges during the anomaly window; the 10-minute net flow reached 755.92 BTC, indicating that some investors chose to transfer funds to exchanges to seek arbitrage opportunities in the midst of the volatility issue
GateNews1h ago
BTC 15-minute pump 0.55%: Large on-chain funds inflows and options positioning resonate to lift spot prices
2026-04-09 17:00 to 2026-04-09 17:15 (UTC), the BTC spot market saw a rapid spike with a +0.55% return. The price range was 72,063.9 to 72,518.5 USDT, and the full-period amplitude reached 0.63%. This upswing coincided with rising market attention; volatility clearly intensified, drawing funds into short-term trading in a mix of cautious sentiment and localized increased volume.
The main driving force behind this move was concentrated inflows to exchanges from on-chain large transfers, which pushed up spot market buy orders in a short time. Data shows that, in the past 24 hours, on-chain BTC transfers
GateNews2h ago
Mainstream CEX and DEX funding-rate displays suggest an increasingly bearish market sentiment
On April 10, the Bitcoin price broke through $72k again. According to Coinglass data, the funding rates on major trading platforms show that the market’s bearish sentiment is strengthening. Funding rates are used to balance the contract price with the asset price; a rate below 0.005% indicates that the market is broadly bearish.
GateNews2h ago
Over the past 1 hour, forced liquidations across the entire market totaled $101 million, including $80.39 million in BTC liquidations.
Gate News message, on April 9, CoinGlass data shows that over the past 1 hour, liquidations across the entire network totaled $101 million, including $97.07 million from short liquidations and $3.54 million from long liquidations. In addition, the liquidation amount for BTC reached $80.39 million, while the liquidation amount for ETH reached $11.79 million.
GateNews3h ago
CME Group BTC futures liquidity falls to a 14-month low, with basis trading failures triggering institutional capital outflows
The Chicago Mercantile Exchange’s Bitcoin futures market has continued to weaken. In March 2026, the daily average open interest fell to $7.2 billion, hitting a new low since February 2024, and has been declining for five straight months. The main reason is the large-scale unwinding of basis trades, which eliminated the arbitrage spread and caused leveraged capital to exit.
GateNews3h ago
