Maple Finance (SYRUP) is hovering around the $0.2700 USD mark at the time of recording on Friday, as buying pressure persistently protects the S1 Pivot support zone at $0.2497 USD. The steady price maintenance indicates that market sentiment is gradually stabilizing after recent fluctuations.
From an on-chain data perspective, demand for this DeFi protocol remains positive. Total Assets Under Management (AUM) has surpassed $4 billion USD, while revenue continues to hold steady after reaching a record high in January — a sign reinforcing investor confidence in the platform.
On the technical side, SYRUP is signaling a potential recovery as selling pressure appears to weaken, opening room for a new upward move if demand continues to be sustained.
Maple Finance Maintains Revenue, Attracts Whales
Data from Dune Analytics dashboards show that Maple Finance has generated $1.46 million USD in revenue so far this month, after hitting a record high of $2.57 million USD — mostly from lending activities and yield optimization strategies. This trend follows steady monthly growth, after the protocol recorded $2.49 million USD in December.
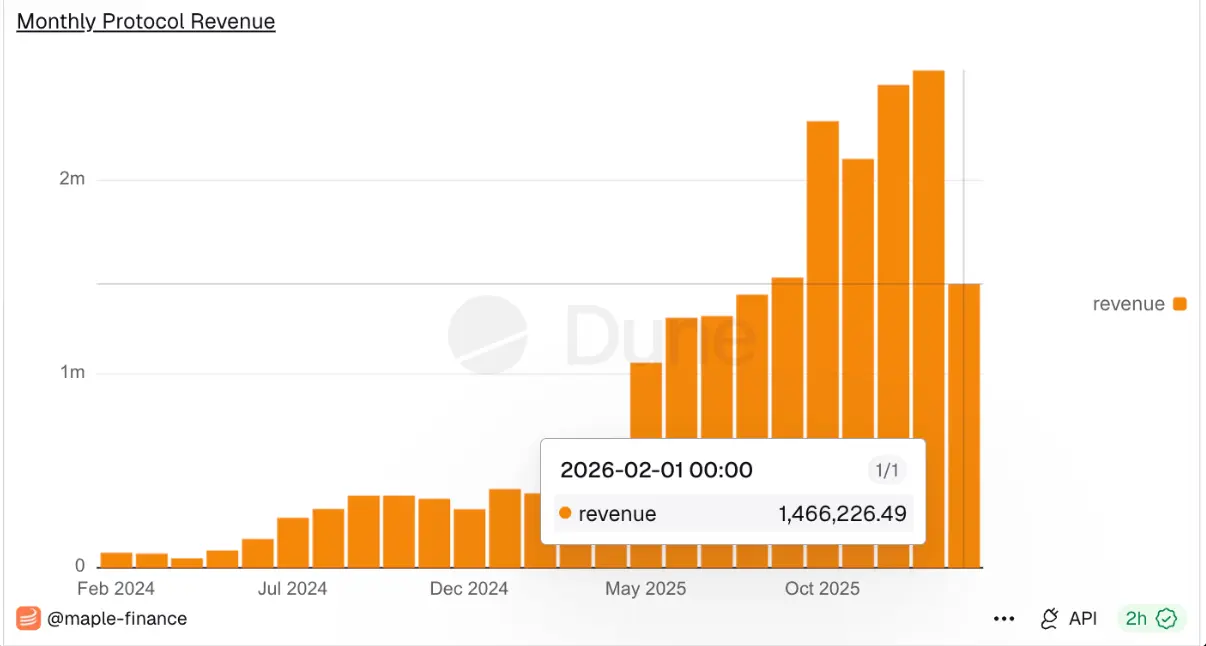 Monthly Revenue of Maple Finance | Source: Dune
Meanwhile, Maple Finance’s total assets under management (AUM) have exceeded $4 billion USD, with lending debt reaching $1.08 billion USD. The combination of stable revenue streams and expanding asset scale indicates that the protocol’s ecosystem is accelerating, benefiting from continuously rising market demand.
Monthly Revenue of Maple Finance | Source: Dune
Meanwhile, Maple Finance’s total assets under management (AUM) have exceeded $4 billion USD, with lending debt reaching $1.08 billion USD. The combination of stable revenue streams and expanding asset scale indicates that the protocol’s ecosystem is accelerating, benefiting from continuously rising market demand.
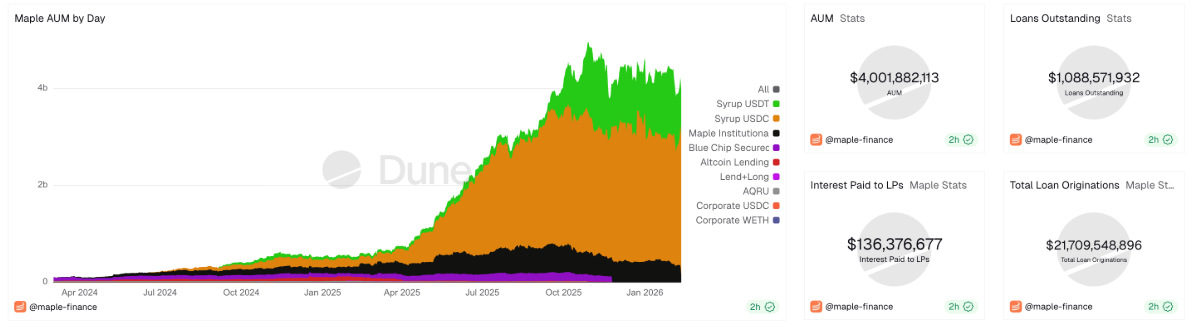 Maple Finance’s Total Assets Under Management (AUM) Data | Source: Dune
Further supporting this positive outlook, data from CryptoQuant shows stable interest from large investors — often called “whales” — as reflected by the average size of SYRUP orders in the spot market, indicating that significant capital is quietly accumulating.
Maple Finance’s Total Assets Under Management (AUM) Data | Source: Dune
Further supporting this positive outlook, data from CryptoQuant shows stable interest from large investors — often called “whales” — as reflected by the average size of SYRUP orders in the spot market, indicating that significant capital is quietly accumulating.
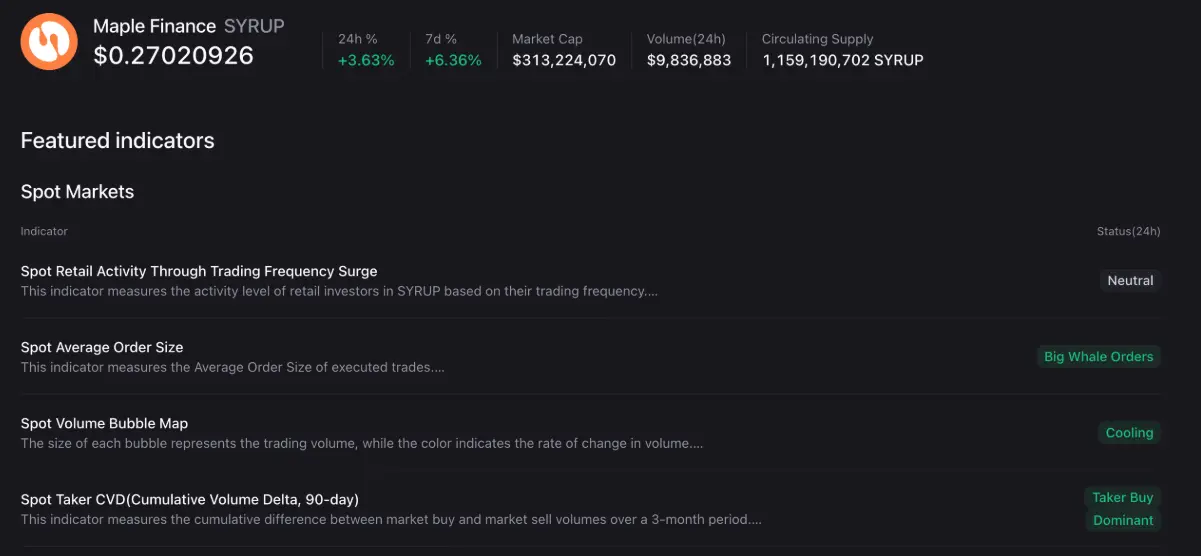 Spot Market Indicators for SYRUP | Source: CryptoQuant
Technical Outlook: Can SYRUP Recover in a Downtrend Channel?
Maple Finance currently trades just above the S1 Pivot level at $0.2497 USD — a short-term support buffer formed after a 31-day decline that saw SYRUP lose about 35% of its value. This movement clearly reflects a downward trajectory within a larger descending channel pattern, established by two parallel trendlines on the daily timeframe.
Conversely, a technical rebound could see SYRUP testing the 50-day Exponential Moving Average (EMA) at $0.3176 USD, before aiming for the 200-day EMA at $0.3666 USD — an area coinciding with the upper boundary of the price channel and serving as a key resistance level.
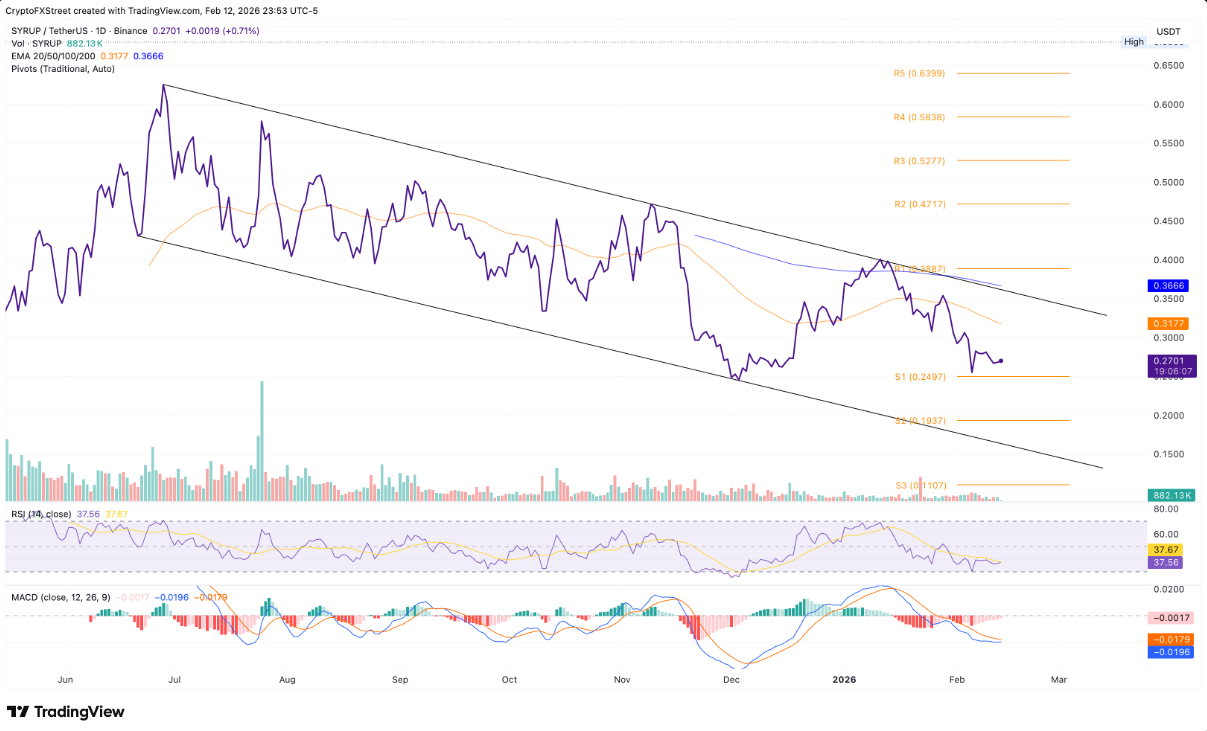 Daily SYRUP/USDT Chart | Source: TradingView
Technical signals suggest selling pressure is gradually weakening. The RSI currently hovers around 36, remaining above the oversold zone and sideways after a deep decline, implying that selling momentum is no longer overwhelming. Additionally, the MACD line is approaching the signal line as the histogram’s negative side narrows, increasing the likelihood of a bullish crossover — a potential short-term reversal indicator.
Daily SYRUP/USDT Chart | Source: TradingView
Technical signals suggest selling pressure is gradually weakening. The RSI currently hovers around 36, remaining above the oversold zone and sideways after a deep decline, implying that selling momentum is no longer overwhelming. Additionally, the MACD line is approaching the signal line as the histogram’s negative side narrows, increasing the likelihood of a bullish crossover — a potential short-term reversal indicator.
However, a negative scenario should still be considered. If SYRUP closes below the $0.2497 USD level, selling pressure could intensify, pushing the price down toward the S2 Pivot at $0.1937 USD.
Disclaimer: The information on this page may come from third parties and does not represent the views or opinions of Gate. The content displayed on this page is for reference only and does not constitute any financial, investment, or legal advice. Gate does not guarantee the accuracy or completeness of the information and shall not be liable for any losses arising from the use of this information. Virtual asset investments carry high risks and are subject to significant price volatility. You may lose all of your invested principal. Please fully understand the relevant risks and make prudent decisions based on your own financial situation and risk tolerance. For details, please refer to
Disclaimer.
Related Articles
$LINK and $PIPPIN Outshine AI Agent Projects By Social Activity
The article discusses the Top 10 AI Agent Projects in cryptocurrency based on social activity, revealing Chainlink ($LINK) as the leader. It highlights engagement and interaction metrics for various projects, indicating strong interest and demand in the market.
BlockChainReporter39m ago
Ethereum Network Activity Claims New ATH Indicating Bullish Divergence
The Ethereum network has reached a new all-time high in activity, signaling its growing utility beyond speculation. Factors like L2 scaling and DeFi are driving this surge, suggesting strong long-term growth potential for Ethereum ($ETH).
BlockChainReporter1h ago
FLOW Recovers From Prolonged Downtrend As Buy-Side Liquidity Builds, Triggering a Potental 22% Br...
The Flow (FLOW) coin is attracting investor interest as its on-chain market continues to pick up fresh momentum, according to a revelation disclosed today by financial analyst Crypto Patel. As per the data posted today, the cryptocurrency has developed a clear bull structure and is displaying a
BlockChainReporter1h ago
PEPE Price Holds Support as Bearish Bets Build Pressure
Key Insights:
PEPE price stabilizes near strong support despite sustained negative funding rates, highlighting a clear divergence between trader sentiment and actual market behavior.
Declining open interest and reduced liquidation activity indicate leverage reset, suggesting the market has c
CryptoNewsLand1h ago
Zcash Price Rally Gains Pace as Shielded Pools Hit Record
Key Insights:
Zcash surged 25% daily and over 60% monthly as strong demand for privacy features drove increased investor participation across the network.
Shielded pool holdings reached $5.18 billion, showing over 31% of supply now locked in private transactions, signaling stronger user
CryptoNewsLand2h ago
'Bitcoin ETF Performance Pales Next to Gold': Mike McGlone - U.Today
Mike McGlone, a Bloomberg strategist, argues that Bitcoin ETFs may not drive long-term growth for Bitcoin, which has underperformed compared to gold. Despite recent gains, Bitcoin's performance seems capped, suggesting a potential peak in crypto enthusiasm.
UToday2h ago
