
Key Takeaways
-
Monad (MON) has dropped nearly 41% over the past two months but is showing early signs of stabilization.
-
Price action suggests a potential double bottom pattern forming near the $0.018 support zone.
-
Buyers have repeatedly defended the same support level, hinting at fading selling pressure.
-
A move above the 50-day moving average could strengthen the short-term bullish outlook.
-
A confirmed breakout above the $0.02970 neckline may open the door for a stronger recovery rally.
Monad (MON), the native token of the Monad Layer-1 blockchain, has been under pressure in recent weeks. The token is down roughly 41% over the past 60 days, driven by a slowdown in TVL growth and a decline in application-level revenue across the ecosystem.
However, sentiment may be starting to shift. MON posted a 12% bounce today, and more importantly, its price structure on the daily chart is beginning to show early signs of a bullish reversal — suggesting the downside momentum could be losing steam.
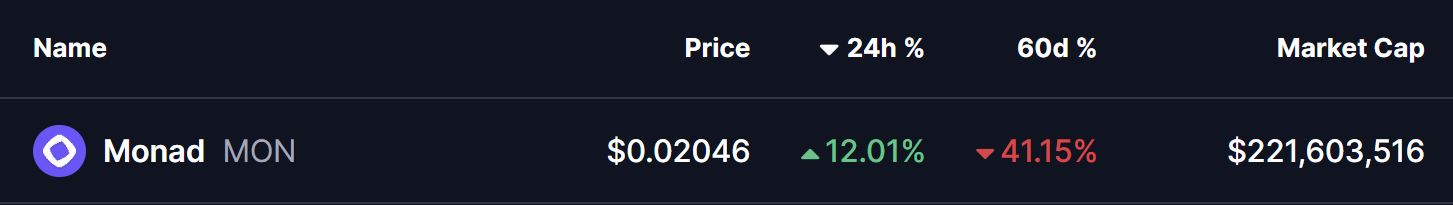
Source: Coinmarketcap
Double Bottom Pattern in Play
On the daily timeframe, MON appears to be forming a potential double bottom pattern, a classic bullish reversal structure that often develops near the end of extended downtrends.
The first bottom was formed when MON dropped toward the $0.018 support zone, followed by a rebound that carried price back toward the neckline resistance near $0.02970. That recovery attempt was rejected, sending MON back down to retest the same support level.
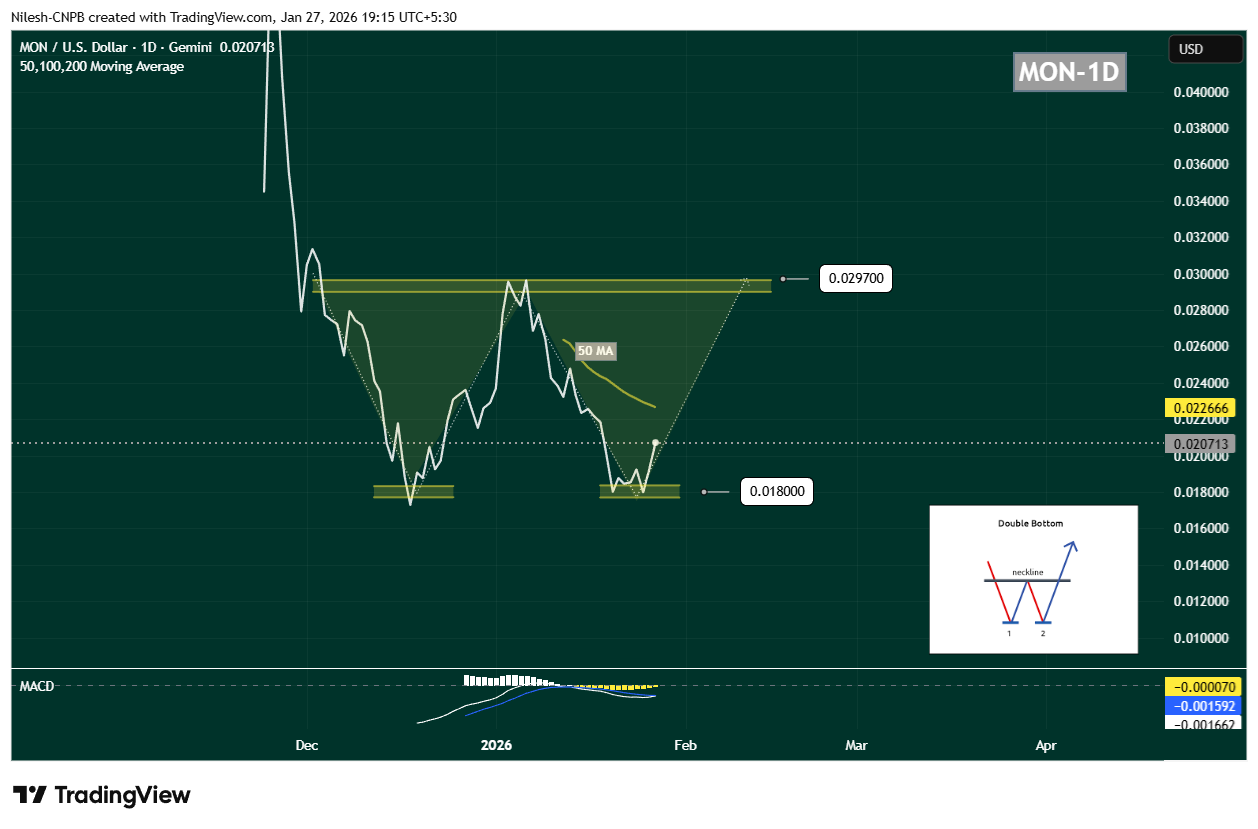
Monad (MON) Daily Chart/Coinsprobe (Source: Tradingview)
What’s notable this time is buyer behavior. Once again, demand emerged around $0.018, preventing a breakdown and forming the second bottom of the structure. MON is currently trading near $0.02071, indicating that selling pressure may be fading.
Momentum indicators are starting to support this view. The MACD is showing early signs of a potential bullish crossover, often seen as an initial signal that downside momentum is weakening and buyers may be preparing to step back in.
What’s Next for Monad (MON)?
For this bullish setup to gain credibility, MON needs to reclaim the 50-day moving average, which is currently positioned near $0.02266. A sustained move above this level would signal a shift in short-term momentum and improve the probability of a recovery rally.
If buyers manage to push price back toward the $0.02970 neckline, the market will be watching closely. A decisive breakout above this resistance, ideally followed by a successful retest, would confirm the double bottom pattern and open the door for a stronger upside move.
On the downside, the $0.018 support zone remains the most critical level to defend. A breakdown below this area would invalidate the bullish structure and likely expose MON to another leg of downside or extended consolidation.
Bottom Line
Despite recent weakness, MON’s technical structure is starting to look constructive. The repeated defense of identical lows, the emergence of a double bottom pattern, and improving momentum signals suggest that Monad could be approaching a potential turning point.
If key support continues to hold and the token reclaims its short-term moving averages, MON may be setting the stage for a recovery phase — especially if broader market conditions stabilize in the days ahead.
Disclaimer: The views and analysis presented in this article are for informational purposes only and reflect the author’s perspective, not financial advice. Technical patterns and indicators discussed are subject to market volatility and may or may not yield the anticipated results. Investors are advised to exercise caution, conduct independent research, and make decisions aligned with their individual risk tolerance.
About Author: Nilesh Hembade is the Founder and Lead Author of Coinsprobe, with over 5 years of experience in the cryptocurrency and blockchain industry. Since launching Coinsprobe in 2023, he has been providing daily, research-driven insights through in-depth market analysis, on-chain data, and technical research.
Disclaimer: The information on this page may come from third parties and does not represent the views or opinions of Gate. The content displayed on this page is for reference only and does not constitute any financial, investment, or legal advice. Gate does not guarantee the accuracy or completeness of the information and shall not be liable for any losses arising from the use of this information. Virtual asset investments carry high risks and are subject to significant price volatility. You may lose all of your invested principal. Please fully understand the relevant risks and make prudent decisions based on your own financial situation and risk tolerance. For details, please refer to
Disclaimer.
Related Articles
BTC Price Plunges to 3-Week Low as Analysts Map Out Next Downside Targets
The first breakdown to under $68,000 seemed as just the beginning for bitcoin’s Friday correction, which just worsened with another dip to a fresh 3-week low.
Most altcoins have followed suit, which has harmed over-leveraged traders, with more than 120,000 such participants being wrecked in the
CryptoPotato17m ago
Bitcoin Cash and NEAR Protocol lead CoinDesk 20 as the market trades sideways
Bitcoin Cash and NEAR Protocol emerged as leaders in the CoinDesk 20 index as the cryptocurrency market remained stagnant. While the index showed no significant movement, BCH increased by 1.5% and NEAR by 1.9%, indicating selective investor interest despite overall market caution.
TapChiBitcoin19m ago
ETH 15-minute price up 0.61%: Active buying comes in, and a breakout above a key level in tandem boosts short-term performance
2026-03-31 13:00 to 13:15 (UTC), ETH fluctuated within the 2047.63 to 2061.18 USDT range. The 15-minute candlestick return recorded +0.61%, with a range of 0.66%. During this period, market attention clearly increased; short-term long sentiment edged upward, volatility intensified, and it attracted incremental liquidity to enter.
The main drivers behind this anomaly are a slight uptick in on-chain trading volume and the emergence of aggressive buy orders. ETH’s on-chain average daily number of transactions remained at a high level of 2,000,000. In the window, spot market trading volume increased, and on-chain transfers accounted for a significant portion of the activity, reflecting increased market participation and liquidity inflows.
GateNews24m ago
Ripple Price Analysis: XRP Enters Q2 With No Bullish Reversal Signs
XRP is wrapping up Q1 2026 at around $1.30, sitting near its lowest levels in the past couple of years. The altcoin has shed the vast majority of its gains from the cycle peak and continues to bleed against both the dollar and Bitcoin. And the worst news? There is no technical sign of a reversal as
CryptoPotato25m ago
Reputed Analyst Says XRP Price Action Still Weak, Expects Significant Move Down
Reputed analyst says XRP price action still weak.
The expect expects a significant move down for XRP soon.
The price of XRP could dip to below $1 before a massive rally to ATH targets.
The crypto community continues to wait for the highly anticipated altseason, even after facing the
CryptoNewsLand25m ago
Wintermute: Bitcoin price is getting ready to “make a big move”! Worst-case scenario could drop into the $60,000 range
Wintermute’s latest weekly market report shows that the ratio of trading volume between Bitcoin perpetual futures and spot markets has reached 15x. Despite market leverage being at elevated levels, there is a lack of consensus, which may signal that larger one-way swings could emerge in the future. Recently, funding rate fluctuations have fallen to low levels, and the impact of a $14 billion options expiry clearing out positions may affect the market’s defensive structure, potentially leading to a highly volatile market. Wintermute proposed two scenario analyses, emphasizing that changes in market structure will trigger significant volatility.
動區BlockTempo1h ago
