Worldcoin (WLD), Canton (CC), and Jupiter (JUP) continue to maintain their upward momentum over the past 24 hours, despite the overall cryptocurrency market showing signs of stagnation following the Federal Reserve’s decision to keep interest rates unchanged announced on Wednesday. While Worldcoin is entering a short-term correction phase, Canton and Jupiter are approaching key resistance zones. From a technical perspective, the strongest performing assets of the day may face a reversal risk as selling pressure at resistance levels continues to increase.
Worldcoin loses momentum after 25% surge
Worldcoin (WLD) experienced a decline of about 5% on Thursday, as the price corrected back from the 100-day Exponential Moving Average (EMA) after a strong 25% breakout the previous day. The 50, 100, and 200-day EMAs remaining downward indicates that the bearish trend still dominates in the medium term.
In a negative scenario, if WLD continues to weaken and breaks below the 50-day EMA at $0.5547, selling pressure could intensify, pushing the price back to a key psychological support level around $0.5000.
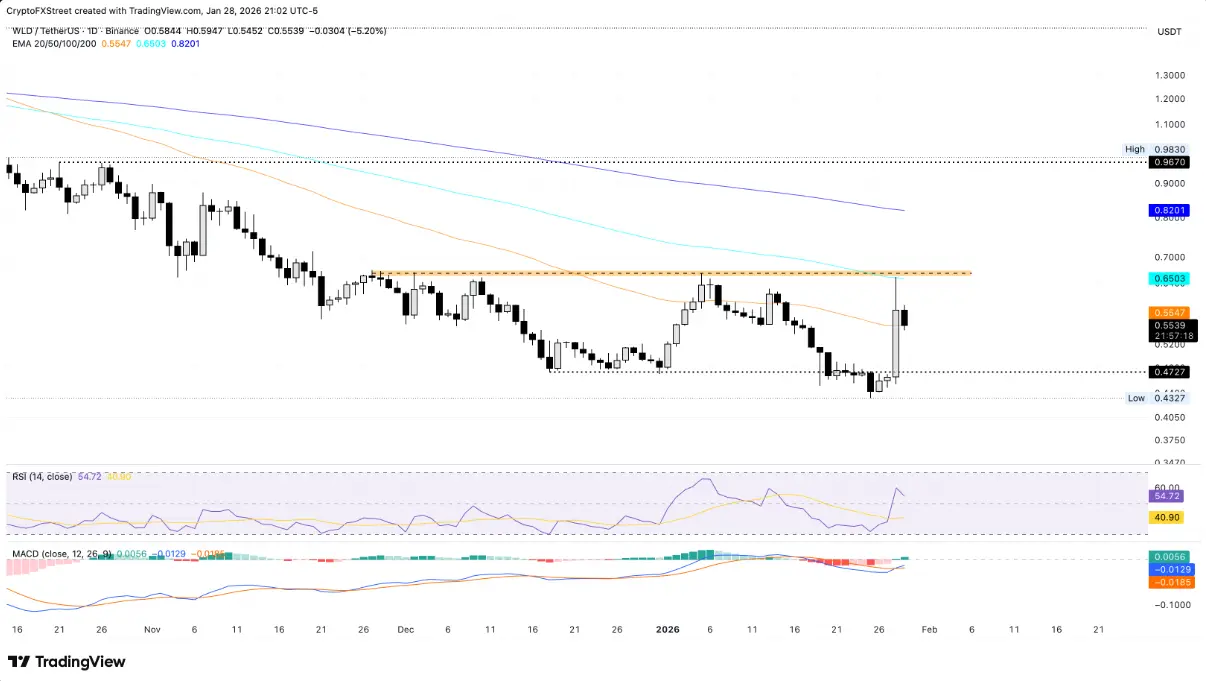 Daily WLD/USDT chart | Source: TradingViewOn the other hand, technical signals are beginning to show signs of improvement. The MACD histogram has shifted into positive territory as the MACD line crosses above the signal line near the zero mark, indicating increasing bullish momentum and the potential for an early recovery. Meanwhile, the Relative Strength Index (RSI) oscillates around 51, reflecting a neutral state and temporary market balance after recent strong volatility.
If WLD can break out and close stably above the 100-day EMA at $0.6503, the recovery momentum is likely to extend, with the next target around the 200-day EMA near $0.8201.
Canton at key resistance, aiming for upside targets
Canton is currently trading near a critical resistance zone at $0.1624, coinciding with the peak recorded on January 2nd. As of this writing, CC has risen slightly by 2% on Thursday, following a 2% increase on Wednesday, indicating stable buying pressure.
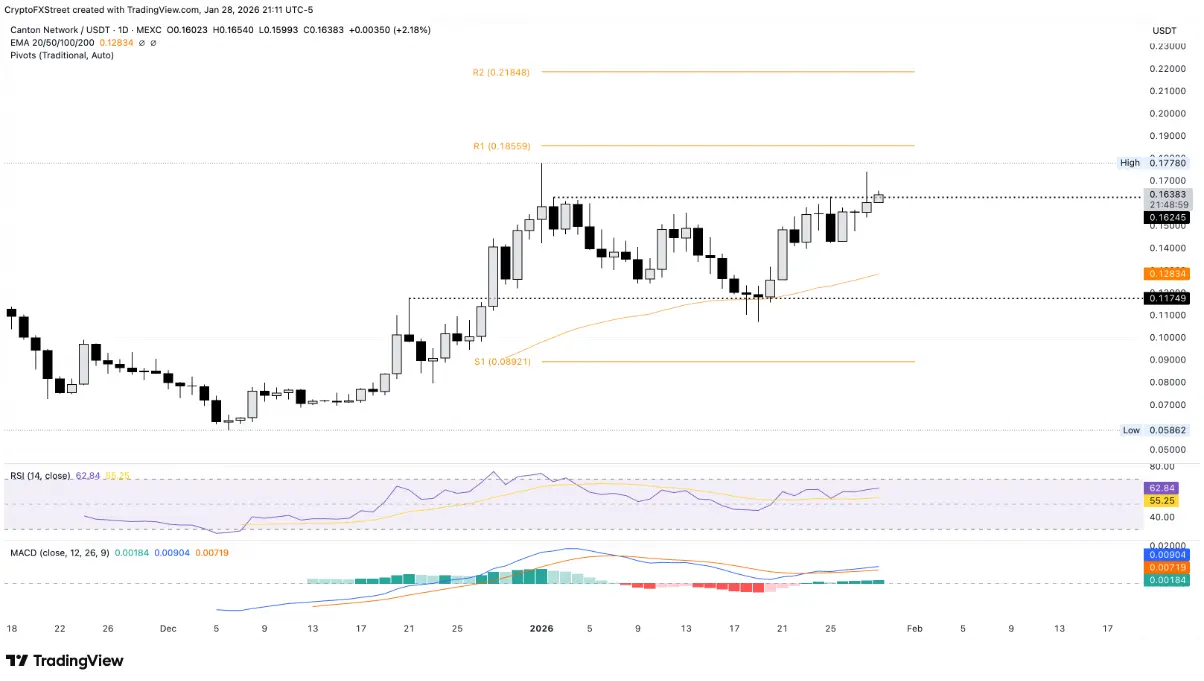 Daily CC/USDT chart | Source: TradingViewIf CC breaks above and closes convincingly above this level, the bullish trend is likely to target the R1 Pivot Point at $0.1855. The RSI remains sideways around 62, reflecting steady buying pressure and room for further gains before reaching overbought territory. Meanwhile, the MACD line and signal line continue to rise above zero, with expanding green histogram bars, confirming strong bullish momentum.
Conversely, if Canton drops below the round level of $0.1500, the 50-day EMA at $0.1283 will serve as an important support zone, helping to curb selling pressure.
Jupiter’s rally stalls at the 50-day EMA
Jupiter (JUP) is facing strong resistance at the 50-day EMA at $0.2174, after experiencing a 16% rally in the first three days of the week. As of now, JUP has declined nearly 1% on Thursday as pressure at the 50-day EMA increases.
If the current trading session closes below this level, the price could revisit the critical psychological level of $0.2000.
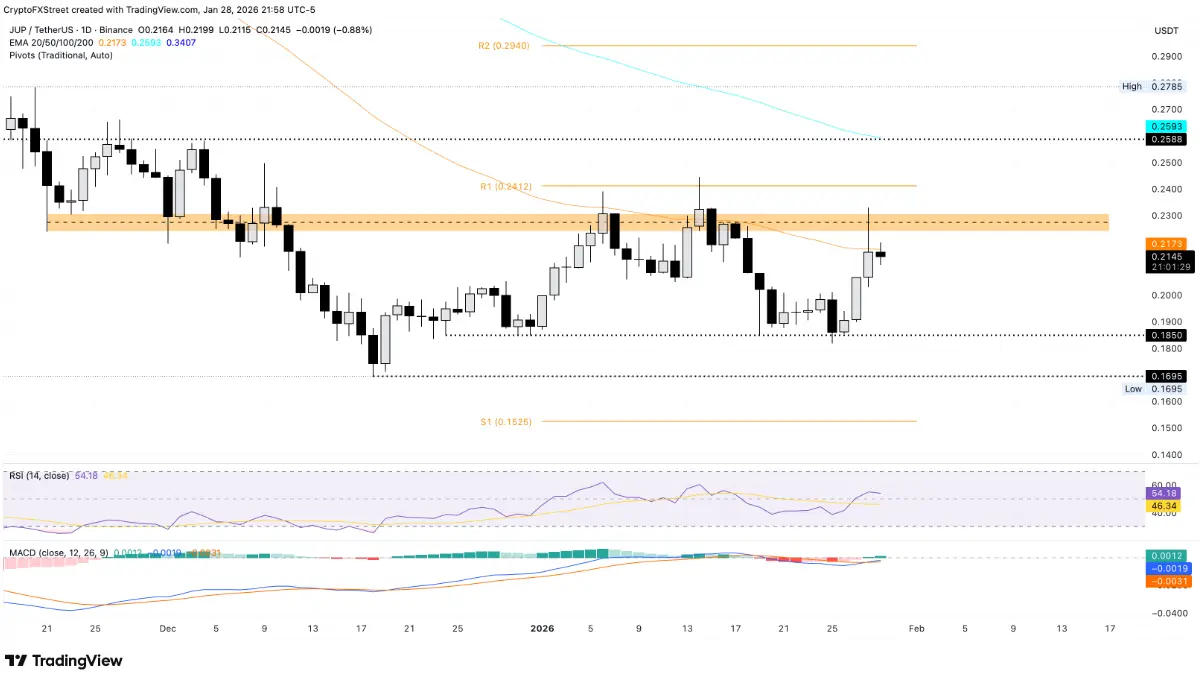 Daily JUP/USDT chart | Source: TradingViewFrom a technical standpoint, the MACD still signals a buy with a bullish crossover forming, while the RSI is at 54 and trending upward from the neutral zone, indicating that buying interest is gradually recovering after the previous rally.
If JUP breaks below the 50-day EMA, the next strong resistance zone between $0.2240 and $0.2308 could potentially control the upward movement.
Disclaimer: The information on this page may come from third parties and does not represent the views or opinions of Gate. The content displayed on this page is for reference only and does not constitute any financial, investment, or legal advice. Gate does not guarantee the accuracy or completeness of the information and shall not be liable for any losses arising from the use of this information. Virtual asset investments carry high risks and are subject to significant price volatility. You may lose all of your invested principal. Please fully understand the relevant risks and make prudent decisions based on your own financial situation and risk tolerance. For details, please refer to
Disclaimer.
Related Articles
Bitcoin falls below 71,500 USD, U.S.-Iran talks remain deadlocked, and the Strait of Hormuz becomes the biggest point of contention
On April 11, the U.S. and Iran began 20 hours of negotiations in Pakistan. The core issue was freedom of passage through the Strait of Hormuz. After Bitcoin briefly rose to $73,800, it quickly fell back to $71,557. The U.S. side took a hardline stance, demanding that Iran open the strait, while Iran insisted that easing restrictions must wait until a comprehensive agreement is reached. The two sides have not yet reached a consensus.
動區BlockTempo3h ago
Crypto Market Maintains Steady Growth Trajectory As Top Assets Show Gains
The crypto market continues to grow, with a market cap of $2.44T and Bitcoin and Ethereum showing slight increases. Top gainers include $GPM and $BASE. Meanwhile, DeFi TVL declined, NFT sales rose, and notable developments include a trader's significant loss and a push for regulatory clarity in Congress.
BlockChainReporter4h ago
BTC 15-minute chart slightly down 0.57%: leveraged long positions passively cut risk and macro sentiment disturbances drive volatility
2026-04-12 12:45 to 13:00 (UTC), the BTC price range was 71081.7 to 71493.2 USDT, with an amplitude of 0.58%. Within 15 minutes, the return recorded was -0.57%. During the period of unusual activity, market volatility increased somewhat, risk sentiment warmed up, and overall attention rose; however, there was no extreme surge in volume or a sudden drop in liquidity.
The main driver behind this unusual activity is that, under the leverage structure, long positions were reduced passively. Recently, the funding rate for perpetual contracts turned from negative to positive. Leverage among longs in the market accumulated; the price dipped slightly, triggering liquidations of some leveraged long positions and sell orders for position closures, resulting in
GateNews6h ago
Analyst: Bitcoin’s current pullback is relatively mild compared with past ones, but the bottom has not been confirmed yet.
Crypto analyst Axel Adler Jr said the current Bitcoin pullback is smaller than historic bearish-market levels, but a bottom has not yet been confirmed. He believes the market is still in a mild bear phase, and that a true recovery will require patience and waiting.
GateNews8h ago
Bitcoin long-term holdings increased to 12.4 million coins, and the 30-day change has remained positive.
CryptoQuant analyst Darkfost says the Bitcoin market is entering an early stabilization phase, with stronger long-term holding behavior. The amount of BTC held for more than a year has increased, and investors are more inclined to hold than to distribute. This suggests the market is transitioning toward long-term conviction; the current trend is viewed as an early stability signal, but it needs longer-term confirmation.
GateNews9h ago
XRP Payments Fall 77% as Price Eyes End to Rally - U.Today
XRP's on-chain payment volume has dropped 77% to 86 million, signaling bearish momentum as its price stagnates below $1.35. This decline has raised investor concerns about potential volatility in the crypto market.
UToday11h ago
