
Key Takeaways
-
Ethereum (ETH) has dropped over 10% this week, trading near $2,980 after rejecting the $3,400 resistance zone.
-
Despite the sell-off, whales and institutions are aggressively accumulating ETH during the dip.
-
On-chain data shows large purchases by Trend Research and an OTC whale via FalconX and Wintermute.
-
ETH continues to trade within a long-term ascending triangle pattern on the daily chart.
-
The rising trendline near $2,900 remains a critical support zone for a potential rebound.
-
A reclaim of the 50-day moving average around $3,088 could revive bullish momentum toward $3,400.
As of January 21, 2026, Ethereum (ETH) is trading near $2,980, down roughly 5% on the day and more than 10% over the past week. The drop follows a rejection from Sunday’s local high around $3,360, as broader market sentiment soured.
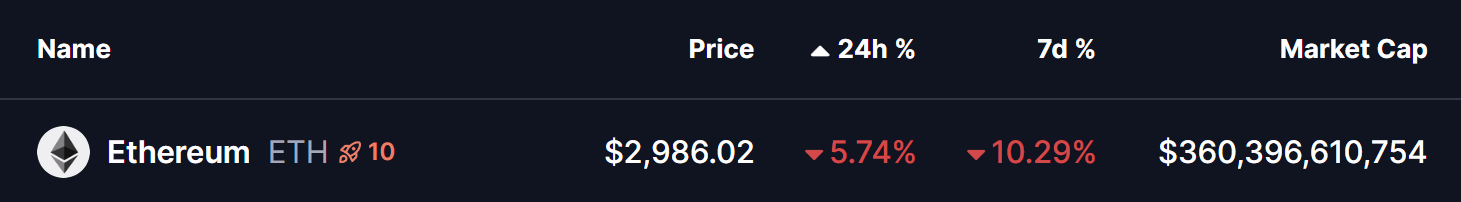
Source: Coinmarketcap
This pullback hasn’t happened in isolation. Rising geopolitical tensions and growing fears around a global commodity super cycle have pushed investors into risk-off mode. Bitcoin (BTC) slipping below $90,000 only added fuel to the sell-off, dragging Ethereum and the wider altcoin market lower.
That said, beneath the surface, Ethereum’s structure still tells a more nuanced story.
Whales Step In on the Ethereum Dip
Despite the sharp correction, large players appear to be treating this dip as an opportunity rather than a warning sign.
On-chain data shared by Lookonchain shows that whales and institutions are actively accumulating ETH during the decline:
-
Trend Research borrowed $70 million USDT from Aave and used it to purchase 24,555 ETH (worth ~$75.5 million). The firm now reportedly holds 651,310 ETH, valued at around $1.92 billion.
-
An OTC whale wallet (0xFB7) acquired 20,000 ETH (approximately $58.8 million) via FalconX and Wintermute.
While short-term price action looks shaky, this kind of buying suggests that smart money may be positioning for a rebound rather than bracing for a deeper collapse.
Ascending Triangle Still Intact on the Daily Chart
Looking at the daily ETH chart, the broader technical structure remains constructive.
Ethereum continues to trade within a well-defined ascending triangle that has been forming since late 2025. This pattern is characterized by:
-
A series of higher lows, supported by a rising trendline
-
A strong horizontal resistance zone around $3,350–$3,400
During the latest sell-off, ETH once again pulled back toward its rising trendline support, currently sitting near the $2,900–$2,920 area. This zone has acted as a reliable demand region multiple times over the past few months.
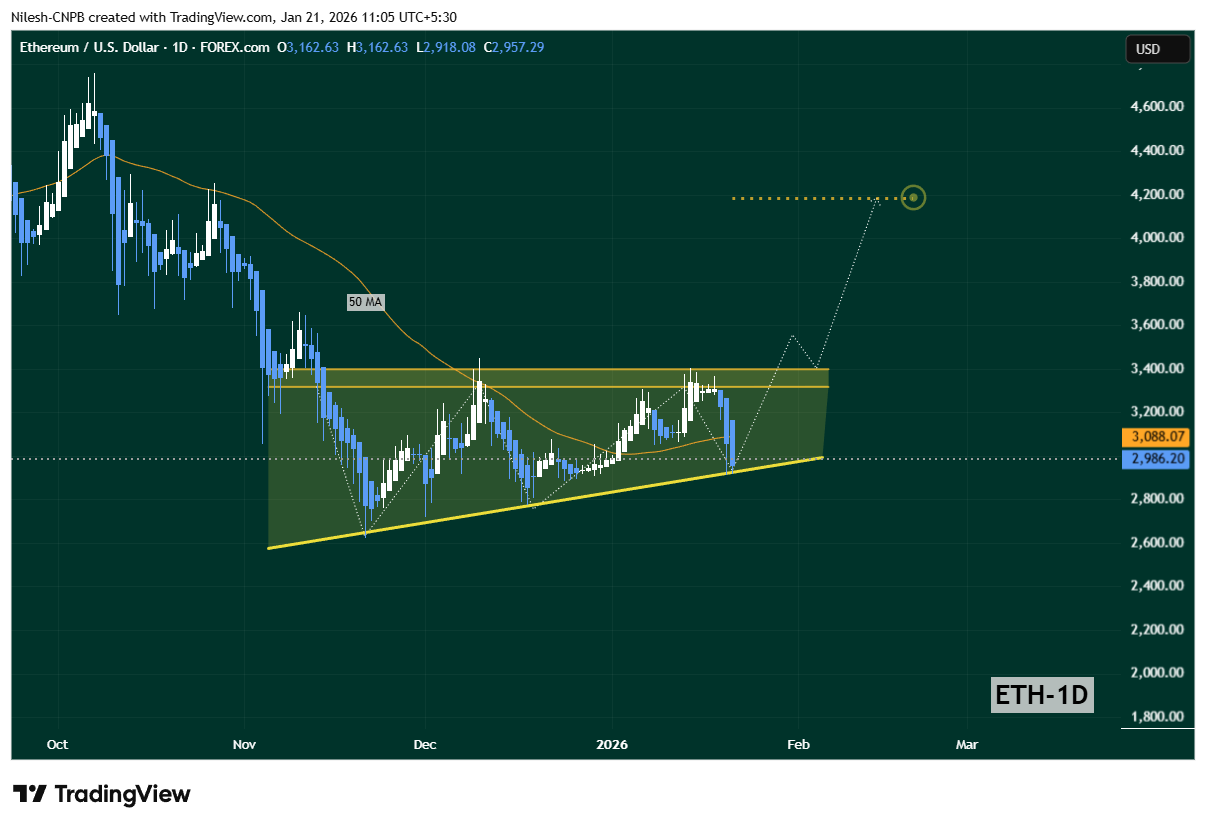
Ethereum (ETH) Daily Chart/Coinsprobe (Source: Tradingview)
For now, price is hovering just above this support, suggesting buyers are still defending it. However, ETH remains below the 50-day moving average, which is currently near $3,088, indicating that short-term momentum has yet to fully recover.
What’s Next for ETH?
If Ethereum manages to hold the ascending trendline near $2,900, the structure of the ascending triangle remains valid. A successful reclaim of the 50-day moving average would be an important first step toward restoring bullish momentum.
Should that happen — especially if broader market conditions stabilize and Bitcoin finds support — ETH could once again make a run at the $3,400 resistance zone, where a breakout attempt would be back on the table.
That said, the risk is clear. A decisive daily close below the rising trendline would weaken the bullish thesis and could open the door to a deeper short-term correction.
For now, Ethereum sits at a critical inflection point — caught between macro-driven fear and quiet accumulation from deep-pocketed players watching the dip closely.
Disclaimer: The views and analysis presented in this article are for informational purposes only and reflect the author’s perspective, not financial advice. Technical patterns and indicators discussed are subject to market volatility and may or may not yield the anticipated results. Investors are advised to exercise caution, conduct independent research, and make decisions aligned with their individual risk tolerance.
About Author: Nilesh Hembade is the Founder and Lead Author of Coinsprobe, with over 5 years of experience in the cryptocurrency and blockchain industry. Since launching Coinsprobe in 2023, he has been providing daily, research-driven insights through in-depth market analysis, on-chain data, and technical research.
Disclaimer: The information on this page may come from third parties and does not represent the views or opinions of Gate. The content displayed on this page is for reference only and does not constitute any financial, investment, or legal advice. Gate does not guarantee the accuracy or completeness of the information and shall not be liable for any losses arising from the use of this information. Virtual asset investments carry high risks and are subject to significant price volatility. You may lose all of your invested principal. Please fully understand the relevant risks and make prudent decisions based on your own financial situation and risk tolerance. For details, please refer to
Disclaimer.
Related Articles
ETH 15-minute drop of 0.62%: Large funds withdrawing in size and ETF net outflows converging to amplify volatility
From 2026-04-05 12:30 to 12:45 (UTC), the ETH price range is 2022.11 to 2037.82 USDT. The 15-minute K-line return is -0.62%, and the amplitude is 0.77%. Against the backdrop of elevated on-chain activity, market attention has increased, volatility has picked up, and this reflects stronger short-term risk-averse sentiment.
The main driver behind this unusual move is that large funds have continued flowing out of exchanges. Data shows that in the past 24 hours, ETH net outflows were as high as -11,970.54 coins, and in the $1M-$10M range, large net outflows were -5
GateNews1h ago
10x Research: Tether’s USDT issuance on Ethereum surpasses Tron—ETH could become the main beneficiary of stablecoin growth
10x Research noted that over the past five years, Ethereum (ETH) has performed lackluster, with its price trading around $2,000, mainly due to weak on-chain activity leading to insufficient demand. After falling 57% from its 2025 peak, ETH’s current valuation remains low, while capital accumulation is still ongoing; USDT’s issuance has surpassed Tron, sparking discussion that ETH could become a leading beneficiary of stablecoin growth. Analysts are now re-evaluating ETH’s potential turning point.
GateNews2h ago
A certain address deposited 1,856 ETH to a certain CEX; if it sells, it will lose $1.89 million.
Gate News message, April 5, on-chain data shows that an address deposited 1,856 ETH into a certain CEX about 45 minutes ago, worth approximately $3.78 million. The address has held ETH for two months, including 1,450 ETH that was withdrawn from an exchange on January 18 when the price was $3,339.38. If sold, it would incur a loss of $1.89 million, with assets shrinking by 39%.
GateNews4h ago
Price predictions 4/3: BTC, ETH, BNB, XRP, SOL, DOGE, HYPE, ADA, BCH, LINK
Key points:
Buyers are attempting to maintain BTC above the $66,500 level, but several analysts believe that the $60,000 level may crack.
Some major altcoins risk breaking below their immediate support levels, signaling that bears remain in control.
Buyers are attempting to push an
Cointelegraph4h ago
