
Key Takeaways
-
SAND price is showing early signs of stabilization after recent downside pressure.
-
Buyers appear to be defending a key support zone, hinting at a potential short-term rebound.
-
A breakout above nearby resistance could open the door for a stronger recovery move.
Gaming-focused crypto tokens are back in the spotlight after Axie Infinity (AXS) posted a sharp rally of over 16% in a single day and more than 246% over the past month, reigniting optimism around the gaming narrative. Riding this renewed momentum, Sandbox (SAND) has also stepped into focus, climbing nearly 45% as overall market sentiment turns constructive.
Beyond the recent price bounce, the technical structure on the chart is starting to tell a bigger story, hinting that SAND may be setting up for a bullish continuation move.
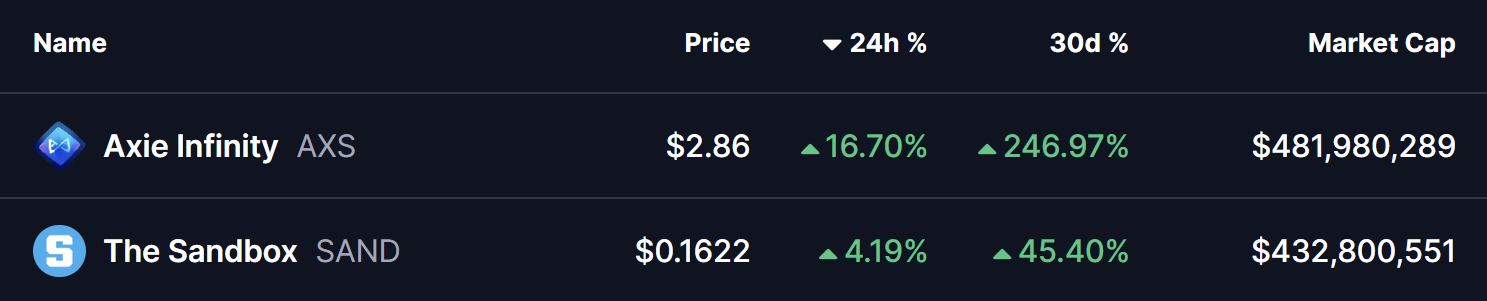
Source: Coinmarketcap
Descending Broadening Wedge Pattern in Play
On the daily timeframe, SAND is trading within a descending broadening wedge — a bullish reversal pattern that often develops during corrective phases before a trend shift. This structure reflects increasing volatility, with price gradually compressing while buyers quietly regain control.
During the latest pullback, SAND successfully retested the lower boundary of the wedge near the $0.11 zone, an area that has repeatedly acted as strong demand. Buyers stepped in aggressively at this level, triggering a rebound that pushed price toward $0.1711, placing SAND right near the wedge’s upper resistance trendline.
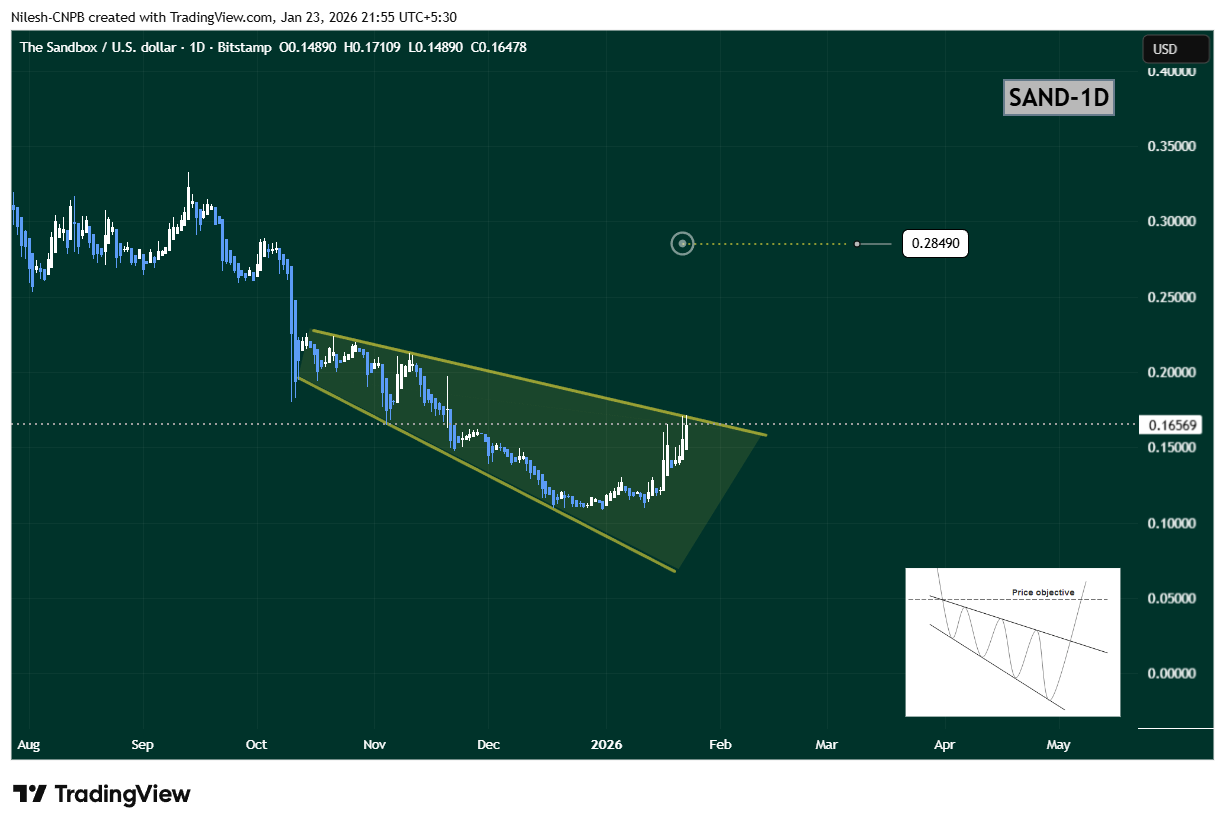
Sandbox (SAND) Daily Chart/Coinsprobe (Source: Tradingview)
The steady rise toward this upper boundary suggests growing bullish momentum and increasing breakout pressure.
What’s Next for SAND?
If buyers manage to push SAND above the upper wedge resistance near $0.1711, it would confirm a bullish breakout from the pattern. In that scenario, the chart opens the door for a move toward the $0.2849 target, which aligns with the measured move of the wedge and represents roughly 73% upside from current levels.
However, if price faces rejection at resistance, SAND could continue consolidating within the wedge structure. In that case, the $0.13–$0.14 region will act as an important short-term support zone to watch.
Bottom Line
SAND’s overall technical structure remains constructive. With a bullish descending broadening wedge in play, buyers defending key support, and gaming tokens gaining renewed attention, Sandbox appears to be positioning for a potential breakout. A confirmed move above resistance could mark the beginning of a stronger upside phase in the sessions ahead.
Disclaimer: The views and analysis presented in this article are for informational purposes only and reflect the author’s perspective, not financial advice. Technical patterns and indicators discussed are subject to market volatility and may or may not yield the anticipated results. Investors are advised to exercise caution, conduct independent research, and make decisions aligned with their individual risk tolerance.
About Author: Nilesh Hembade is the Founder and Lead Author of Coinsprobe, with over 5 years of experience in the cryptocurrency and blockchain industry. Since launching Coinsprobe in 2023, he has been providing daily, research-driven insights through in-depth market analysis, on-chain data, and technical research.
Disclaimer: The information on this page may come from third parties and does not represent the views or opinions of Gate. The content displayed on this page is for reference only and does not constitute any financial, investment, or legal advice. Gate does not guarantee the accuracy or completeness of the information and shall not be liable for any losses arising from the use of this information. Virtual asset investments carry high risks and are subject to significant price volatility. You may lose all of your invested principal. Please fully understand the relevant risks and make prudent decisions based on your own financial situation and risk tolerance. For details, please refer to
Disclaimer.
Related Articles
Stablecoins aren’t just for cross-border payments—they’re for going local too! a16z’s latest report: Asia supports two-thirds of transaction volume
Crypto VC giant a16z’s latest report, “9 charts on what stablecoins are becoming,” uses nine key charts to depict the structural changes underway in stablecoins. The report’s central takeaway is not new tokens or new narratives, but stablecoins’ role shifting from “trading tools” and “savings vehicles” to “core financial infrastructure,” along with an increasingly strong degree of localization—creating a clear gap between what the market originally expected and the reality of cross-border payments.
**GENIUS Act in the U.S. boosts stablecoin trading volume to $4.5 trillion in Q4**
For years, regulatory uncertainty has been the ceiling for institutional participation in stablecoins. The turning point came from the U.S. GENIUS Act establishing the first federal-level stablecoin issuance framework. a16z data shows that, prior to the bill’s passage, the adjusted stablecoin trading volume had already been rising for several consecutive quarters.
ChainNewsAbmedia29m ago
Humanity Protocol Rallies 80% From April Lows, But Is the Momentum Fading?
Humanity Protocol surged 80% from April lows, breaking into top 100 crypto assets.
Whale activity and network growth rose, but trading volume dropped sharply by 46%.
Bullish structure remains intact, with key resistance and support levels defining the next move.
Humanity Protocol — H, ha
CryptoNewsLand1h ago
PENGU Eyes 30% Rally as Analyst Flags Crucial Breakout Level
PENGU consolidates near $0.009 resistance after a long 90% decline from highs.
Analysts expect a 30% rally if breakout above key resistance level confirms strength.
ETF speculation and ecosystem growth could fuel volatility and upside momentum.
Pudgy Penguins — PENGU, is sitting at a
CryptoNewsLand3h ago
Analyst: $80K Emerges as Bitcoin's Key Resistance Level, Breakout Could Trigger Increased Volatility
Gate News message, April 26 — On-chain analyst Murphy identified $80,000 as Bitcoin's primary resistance level above the current price, citing a combination of options Gamma exposure, open interest (OI), and implied volatility (IV) data. The level represents a critical checkpoint for May's price
GateNews4h ago
Crypto Fear and Greed Index Falls to 32, Indicating Panic State
Gate News message, April 26 — The Crypto Fear and Greed Index currently stands at 32, up 2 points from the previous day, according to Coinglass data. The index is in a panic state.
The seven-day average is 34, while the 30-day average is 19, indicating elevated market anxiety over the past
GateNews5h ago
PLA Plummets 47.8% in 30 Minutes, Dropping Below $0.12
Gate News message, April 26 — PLA (PlayDapp) price crashed 47.8% in just 30 minutes today, falling to $0.1225. The token, which hit a day high of $0.2347, now trades at $0.122512 with a market cap of approximately $305 million. Trading volume remains notably low, reflecting reduced investor
GateNews5h ago