XRP trading volume surges 171%, breaking below the key support at $1.90. Trump threatens to impose 100% tariffs on Canadian goods, intensifying bearish pressure. The Fear & Greed Index plummets to 29. The Asian session sees a brief rebound from $1.80, but overall volatility remains severe. XRP tests the $1.90 structural resistance again; failure to break through will likely lead to a rapid drop to $1.80, with further downside targets at $1.60.
XRP breaks below $1.90 with trading volume soaring 171%
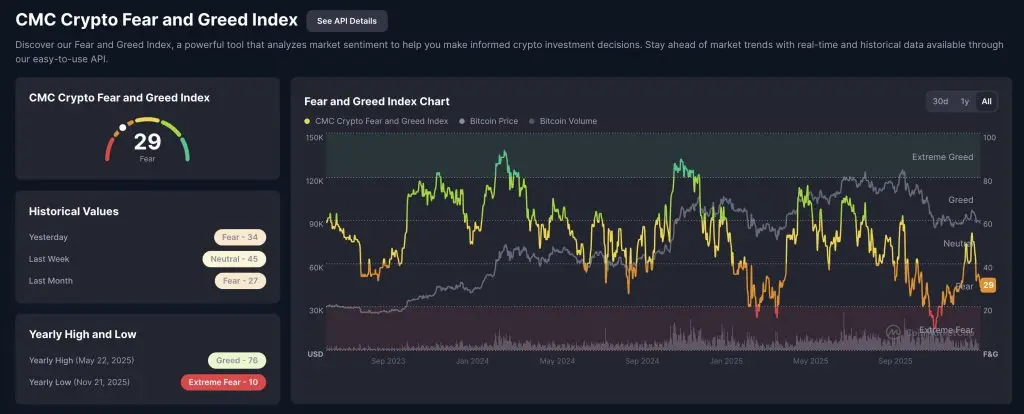
(Source: CMC)
Over the past week, XRP has declined by 4%, with trading volume skyrocketing 171%, as the token broke through the critical support at $1.90. The surge in trading activity indicates increasing uncertainty, casting doubt on the recent bullish price forecasts dominating the market sentiment. Explosive volume growth often occurs at market turning points, when significant disagreements among investors about the future direction lead to intense buying and selling battles, pushing volume higher. The 171% increase shows XRP is experiencing a crucial moment of directional choice.
Following Donald Trump’s threat to impose 100% tariffs on Canadian goods if Canada reaches a trade deal with China, bearish pressure has intensified. This geopolitical uncertainty directly impacts assets like XRP, which are deeply tied to cross-border payments. XRP’s core use cases are international remittances and cross-border settlements. If global trade contracts due to tariff conflicts, actual demand for XRP could decline, worsening the fundamental outlook and adding downward pressure on the price.
Although XRP briefly rebounded from $1.80 during the Asian trading session, overall market volatility continues to exert serious pressure on the price trend. This rebound lacks strength and sustainability, more akin to a technical retracement during a downtrend. Rapid declines often trigger short-term rebounds in oversold conditions, but without fundamental support, these bounces tend to be opportunities for new short positions.
The Fear & Greed Index shows market sentiment has deteriorated over the past few weeks, dropping sharply from 54 on January 14 to 29 at the time of writing. The index measures overall crypto market sentiment on a scale from 0 (extreme fear) to 100 (extreme greed). Falling from a neutral/greedy level of 54 to a fear zone at 29 indicates a dramatic shift in sentiment within just two weeks. This deterioration affects not only XRP but the entire crypto market, though XRP’s unique regulatory and application scenarios may subject it to even greater stress.
Now, traders are speculating whether XRP will drop to zero, so it’s time to look at the charts. Although such extreme panic-based speculation is not rational, it reflects how badly market sentiment has worsened. When investors start discussing the possibility of “going to zero,” it usually signals that panic has reached a peak.
XRP tests $1.90 resistance failure could lead to $1.60

(Source: Trading View)
XRP is currently retesting the critical structural resistance at $1.90. This level was previously a major support in a bearish structure, meaning that a breakout above it would confirm a trend reversal. However, both technical and fundamental setups are unfavorable for a breakout. If the price fails to breach this level, it could quickly fall to $1.80, increasing the risk of further declines. The most likely target (not touched in months) is around $1.60.
Why is $1.90 so important? From a technical analysis perspective, this level has repeatedly served as support and resistance over the past few months. Once support is broken, it often turns into resistance. XRP testing this level from below will determine whether the trend reverses or continues downward. Volume distribution shows heavy historical trading around $1.90, with concentrated positions that tend to create strong resistance zones.
$1.80 is the next key support level. If XRP cannot hold above $1.90 and quickly drops to $1.80, the speed of this decline could trigger panic. Rapid drops often activate stop-loss orders and leverage liquidations, creating a chain reaction. There may be some buy support near $1.80, but in current panic conditions, its effectiveness remains uncertain.
$1.60 is a deeper target. This level represents a significant support zone from previous months’ lows. If XRP truly drops to $1.60, it would be about 13.5% below the current price of approximately $1.85. Such a decline is well within XRP’s typical volatility range, especially given the current macro environment and market sentiment.
Three price scenarios for XRP
Reversal scenario: Break above $1.90 confirms trend reversal, target $2.10–$2.30
Continued decline: Fail to hold $1.90, drop to $1.80, increasing downside risk
Deep correction: Break below $1.80, test $1.60 (-13.5%), first time in months
Therefore, although the possibility of dropping to zero is extremely small, the current situation favors a bearish outlook. XRP going to zero would require Ripple to go bankrupt, the XRP Ledger to cease operation, and all use cases to vanish simultaneously—an almost impossible scenario in reality. Ripple remains a functioning company, the XRP Ledger still has active validator nodes, and real-world applications, though slow-growing, still exist. Hence, the “going to zero” narrative is more an extreme expression of panic than a rational price forecast.
Trump tariffs threats and market structure bill delays double hit
Following Donald Trump’s threat to impose 100% tariffs on Canadian goods if Canada reaches a trade agreement with China, bearish pressure on XRP has intensified. This tariff threat has multiple layers of impact. First, it exacerbates global trade tensions, increasing risk aversion among investors. When seeking safe havens, they typically prefer gold, USD, or US Treasuries over cryptocurrencies. Second, the trade war could slow global economic growth, reducing cross-border payment demand, directly affecting XRP’s use cases.
In addition to tariff threats, XRP faces ongoing regulatory uncertainty. Although Ripple’s lawsuit with the SEC has largely concluded, the delay of the Market Structure Bill leaves XRP’s long-term regulatory status unclear. Investors initially expected this bill to provide a clear legal framework for XRP and other crypto assets, but repeated postponements have weakened this expectation, increasing market uncertainty.
From a technical standpoint, breaking below $1.90 support is a clear bearish signal. Support breaches often trigger algorithmic sell orders and stop-loss triggers among retail investors. This concentrated selling can generate significant downward momentum, accelerating the decline. The 171% surge in volume partly results from these passive sell-offs and partly from active shorting. As market sentiment turns to panic, the appeal of short positions increases, further intensifying downward pressure.
XRP spot ETF performance is also not optimistic. Although not detailed here, previous reports indicate that XRP ETFs have experienced outflows in the past week. Institutional investors withdrawing via ETFs suggest a pessimistic outlook among professional funds. Such institutional behavior often serves as a leading indicator, as these entities have more resources for in-depth analysis.
Disclaimer: The information on this page may come from third parties and does not represent the views or opinions of Gate. The content displayed on this page is for reference only and does not constitute any financial, investment, or legal advice. Gate does not guarantee the accuracy or completeness of the information and shall not be liable for any losses arising from the use of this information. Virtual asset investments carry high risks and are subject to significant price volatility. You may lose all of your invested principal. Please fully understand the relevant risks and make prudent decisions based on your own financial situation and risk tolerance. For details, please refer to
Disclaimer.
Related Articles
XRP Trading Volume Surges Across Major Exchanges, Signaling Renewed Market Interest
Gate News message, April 23 — XRP trading volume has spiked across major exchanges, with leading platforms recording significant activity. According to market data, trading volumes reached approximately $25 million in total across top exchanges, indicating broad-based participation rather than
GateNews1h ago
GraniteShares Delays 3x Leveraged XRP ETF to May 7, 2026
Gate News message, April 23 — GraniteShares has delayed the launch of its 3x leveraged XRP ETF to May 7, 2026, according to a filing amendment submitted on April 23. The delay affects both 3x long and 3x short XRP funds, as well as similar leveraged products tied to Bitcoin, Ethereum, and Solana.
T
GateNews2h ago
BlackRock, Mastercard and Franklin Templeton Test XRP Ledger for Stablecoins
BlackRock, Mastercard, and Franklin Templeton test XRPL for stablecoin payments, focusing on infrastructure not trading use cases.
Ripple partnerships enable tokenized funds like BUIDL and VBILL to convert into RLUSD for continuous onchain liquidity flows.
XRP Ledger activity rises as
CryptoFrontNews2h ago
XRP Spot ETF Records $2.41M Net Inflows in Single Day; Bitwise XRP ETF Leads
Gate News message, April 23 — According to SoSoValue, XRP spot ETFs recorded net inflows of $2.41 million yesterday (April 22 ET). Bitwise XRP ETF (XRP) accounted for the entire daily inflow, bringing its historical cumulative net inflows to $419 million.
As of press time, total assets under
GateNews11h ago
LOBSTR Wallet Integrates XRP Ledger Support, Unlocking Access for 1.3M+ Users
Abstract: The article surveys XRPL ecosystem expansion, highlighting wallet integrations (LOBSTR with XRPL Commons; Exodus custody tools) and rising institutional interest from Mastercard, BlackRock, and Franklin Templeton as XRPL real-world asset activity grows toward a multi-billion-dollar valuation, underpinned by fast settlement and low fees.
Summary: LOBSTR adds XRP Ledger support via XRPL Commons; Exodus expands XRP/RLUSD custody tools. Mastercard, BlackRock, and Franklin Templeton monitor XRPL as RWA activity climbs toward $2.5B, enabling fast, low-cost settlements.
GateNews16h ago
XRP Price Near $1.45 as ETF Inflows Build Pressure
Key Insights
Institutional XRP ETF inflows reached $41.6 million over four days, lifting assets under management above $1.08 billion and strengthening market confidence.
XRP faces strong resistance near $1.45, where CoinGlass data highlights a short max
CryptoNewsLand18h ago