XRP has fallen for four consecutive days to $1.8339, impacted by Trump’s 100% Canadian tariff threat, the hawkish stance of the Bank of Japan, and bill delays on multiple fronts. ETF inflows have ended after 10 weeks, breaking below the double moving averages. $1.85 remains a key support level, with bulls still betting on a long-term target of $3.66.
Trump’s 100% Canadian Tariff Threat Deals a Heavy Blow to Market Confidence
Over the weekend, US President Trump shifted focus from Greenland and NATO countries to Canada, dampening interest in XRP and the broader crypto market. This weekend, Trump responded to a trade agreement between Canada and China, which could provide Chinese manufacturers an alternative route to bypass US tariffs. He stated: “If Governor Canning thinks he can turn Canada into a ‘transshipment port’ for goods sent from China to the US, he’s dead wrong. If Canada reaches an agreement with China, all Canadian goods entering the US will face 100% tariffs immediately.”
Importantly, the US is Canada’s largest trading partner, accounting for over 70% of Canadian exports. Canada’s trade volume makes up about 65% of GDP, so imposing 100% tariffs on goods destined for the US would have a significant impact on the Canadian economy and global trade. Chinese manufacturers could also feel the indirect effects of 100% tariffs, with a more pronounced impact on global trade patterns.
The XRP and crypto spot ETF markets remain highly sensitive to trade-related developments. For example, Trump previously threatened to impose 100% tariffs on China in October 2025, triggering a flash crash in XRP. The price plummeted from $2.8406 to a low of $0.7773, then rebounded to $2.00. The painful memory of this flash crash remains vivid, and when investors see Trump threaten 100% tariffs again, they immediately withdraw to avoid risks.
Last week, Trump threatened to impose a 10% tariff on eight NATO European member countries. The XRP spot ETF market ended a 10-week streak of inflows, suppressing buying interest in XRP. This shift from continuous inflows to outflows signals a decline in institutional investors’ risk tolerance regarding geopolitical risks. The bullish momentum built over 10 weeks was quickly shattered by tariff threats.
The Bank of Japan’s Hawkish Shift Triggers Panic in Arbitrage Trade Liquidations
Meanwhile, the Bank of Japan adopted a more hawkish stance and warned of potential intervention in the yen exchange rate, pushing the yen higher and increasing the risk of arbitrage trade liquidations. Yen arbitrage trading is a key liquidity source in global financial markets, where investors borrow yen at low interest rates and invest in higher-yield assets, including cryptocurrencies. When the BOJ adopts a hawkish stance and hints at rate hikes, borrowing costs increase, and profit margins for arbitrage trading narrow or vanish.
The BOJ has signaled multiple rate hikes to reach a hawkish neutral rate (possibly between 1.5%-2.5%). Raising the neutral rate would narrow the US-Japan interest rate differential, potentially triggering yen arbitrage liquidations similar to mid-2024. In August 2024, an unexpected rate hike by the BOJ caused intense global market volatility, with the crypto market losing billions in a single day. If history repeats, XRP will be the first to suffer. Liquidation of yen arbitrage trades would negate the short-term bullish outlook.
Four Major Downside Risks Facing XRP
Hawkish BOJ: Multiple rate hikes narrowing US-Japan interest rate differential, triggering arbitrage liquidations
Fed Delays Rate Cuts: Reducing expectations for rate cuts in the first half of 2026
Legislative Blockages: Market structure bill further delayed due to partisan opposition
ETF Outflows: XRP spot ETF reports ongoing capital outflows
These events will pressure risk assets, causing XRP to break below $1.85 and signaling a reversal of the bearish trend.
Technical Analysis and the Key $2.0 Breakout
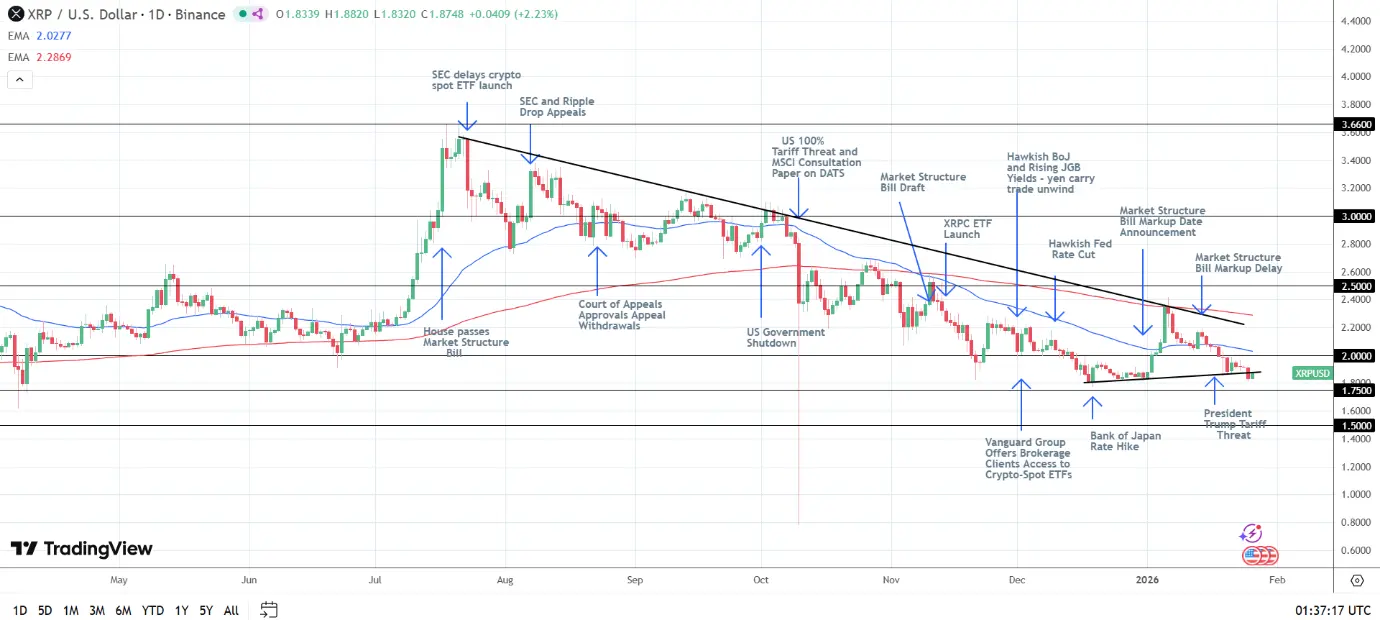
(Source: Trading View)
On January 25, XRP fell 4.16%, after a 0.25% decline the previous day, closing at $1.8339. The token’s decline was greater than the overall crypto market (down 3.06%). However, XRP rebounded in early trading on Monday, January 26, briefly rising above $1.85. Despite this, the decline caused XRP’s trading price to fall below its 50-day and 200-day moving averages, indicating a bearish bias. Nonetheless, bullish fundamentals continue to offset technical weakness, reinforcing a positive market outlook.
Key Technical Levels to Watch
Support Levels: $1.85, $1.75, $1.50
50-Day Moving Average Resistance: $2.0277
200-Day Moving Average Resistance: $2.2869
Upper Resistance: $2.0, $2.5, $3.0, $3.66
On the daily chart, breaking above $2.0 will activate the 50-day moving average. Importantly, sustained breakout above the 50-day MA would signal a short-term bullish reversal. A bullish reversal would allow bulls to target $2.2. Breaking above $2.2 would pave the way for further testing of the 200-day MA. Notably, if prices continue to break above EMA lines, it would solidify medium- and long-term bullish targets: $3.0 in 4-8 weeks, and $3.66 in 8-12 weeks.
Despite last week’s outflows, three consecutive days of inflows up to January 23 indicate strong market demand for XRP spot ETF, confirming a short-term (1-4 weeks) bullish outlook with a target of $2.5. Additionally, market expectations that the Senate will pass the Market Structure Bill continue to support XRP’s current price levels. Over the next 12 weeks, these key events could push XRP to a new all-time high of $3.66. If broken, the target price for the next 6-12 months could reach $5.
Disclaimer: The information on this page may come from third parties and does not represent the views or opinions of Gate. The content displayed on this page is for reference only and does not constitute any financial, investment, or legal advice. Gate does not guarantee the accuracy or completeness of the information and shall not be liable for any losses arising from the use of this information. Virtual asset investments carry high risks and are subject to significant price volatility. You may lose all of your invested principal. Please fully understand the relevant risks and make prudent decisions based on your own financial situation and risk tolerance. For details, please refer to
Disclaimer.
Related Articles
Ripple CEO praises SEC’s new direction, and U.S. crypto regulation enters a reset mode
Ripple CEO Brad Garlinghouse publicly praised the regulatory shift driven by the newly appointed Securities and Exchange Commission (SEC) chair, Paul Atkins, on April 20, describing it as “a refreshing breath of sanity that helps people regain their composure.” Garlinghouse viewed the SEC’s policy pivot as the key driver behind an improvement in sentiment across the U.S. crypto market.
MarketWhisper1h ago
SoFi Adds XRP Deposits, Ripple: Broader Access Drives Practical Growth
American fintech company SoFi Technologies announced on April 21 that it would add XRP deposit services to its platform, bringing this digital asset into the national chartered bank environment overseen by the Office of the Comptroller of the Currency (OCC). SoFi currently supports trading of 27 cryptocurrencies and offers a range of crypto deposit features. Ripple says this is the path to real utility-driven growth.
MarketWhisper1h ago
SoFi Enables XRP Deposits but Restricts Withdrawals, Drawing User Criticism
Gate News message, April 21 — SoFi announced that its crypto business now supports XRP deposits, but the platform currently does not allow withdrawals to external wallets. Users can only hold or trade XRP within the platform and cannot transfer tokens to on-chain wallets.
Some users criticized the
GateNews5h ago
XRP Price Near $1.45 as ETF Inflows Build Pressure
Key Insights
Institutional XRP ETF inflows reached $41.6 million over four days, lifting assets under management above $1.08 billion and strengthening market confidence.
XRP faces strong resistance near $1.45, where CoinGlass data highlights a short max
CryptoNewsLand10h ago
XRP Expands to Solana as wXRP Drives DeFi Access
Key Insights
Wrapped XRP on Solana surpasses 834,000 tokens, enabling new DeFi access while strengthening cross-chain liquidity and expanding XRP utility beyond its native ledger.
Ethereum and Solana dominate DeFi activity, while XRP Ledger trails significantly, driving the need for
CryptoNewsLand10h ago
