
Key Takeaways
-
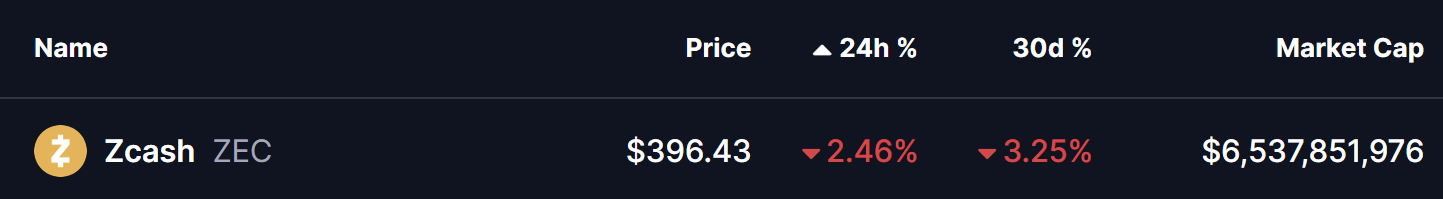
Zcash (ZEC) is trading near the $396–$397 range after losing momentum following a sharp 2025 rally.
-
The resignation of Zcash’s core development team triggered strong selling pressure and weakened market confidence.
-
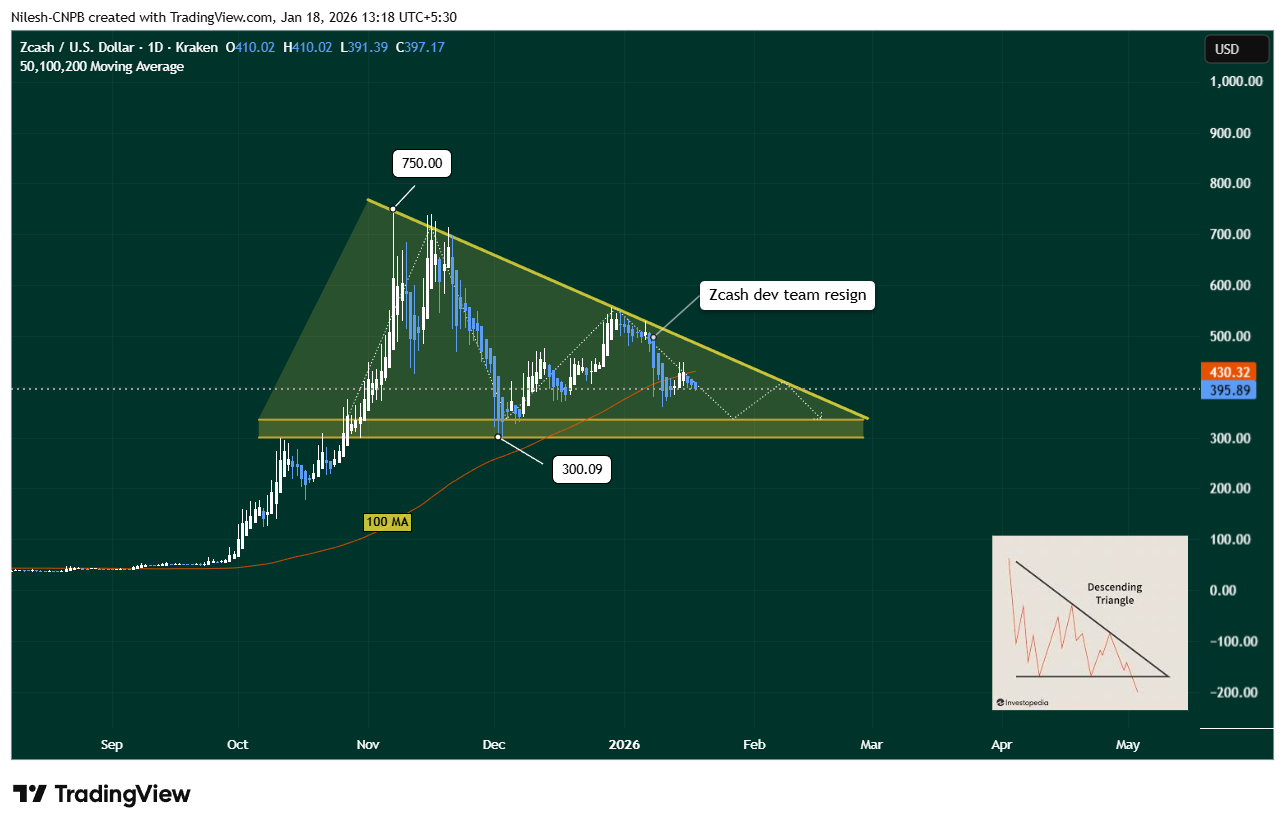
The daily chart shows a descending triangle, a bearish continuation pattern signaling increasing seller control.
As of January 18, 2026,** Zcash (ZEC) **is trading around the $396–$397 range, extending its recent weakness with a nearly 2.5% drop over the last 24 hours. While the move may look modest on the surface, it reflects a broader shift in sentiment following ZEC’s explosive 2025 rally, where the privacy-focused coin surged more than 800% at its peak.
That momentum has clearly faded in early 2026, and both fundamentals and technicals are now flashing caution signals.
Source: Coinmarketcap
Developer Exodus Shakes Confidence
The biggest overhang for Zcash came earlier this month when the entire core development team at Electric Coin Company (ECC) stepped down. The resignations, which occurred around January 7–8, were linked to governance disputes with the Bootstrap nonprofit board overseeing the project.
Markets reacted swiftly. ZEC sold off sharply from the $480–$500 region, erasing weeks of gains in a matter of days. For a project built around long-term cryptographic research and privacy innovation, uncertainty around leadership and development direction has weighed heavily on investor confidence.
Descending Triangle Takes Shape
From a technical standpoint, Zcash’s daily chart now shows a clear descending triangle, a structure that typically signals bearish continuation after a strong uptrend.
The pattern is defined by:
-
A flat support zone between $300 and $335, which has repeatedly attracted buyers.
-
A series of lower highs, forming a downward-sloping resistance line from the 2025 peak near $750.
As price compresses within this triangle, volatility has steadily declined — often a precursor to a decisive move. Adding to the bearish bias, the 100-day moving average continues to cap upside attempts, acting as dynamic resistance during recent rebounds.
Zcash (ZEC) Daily Chart/Coinsprobe (Source: Tradingview)
The chart also highlights how the sharp sell-off began almost immediately after the developer resignation news, reinforcing the connection between fundamentals and technical weakness.
What’s Next for ZEC?
If bearish pressure persists, ZEC could gradually slide toward the lower boundary of the triangle, putting the $300–$335 support zone back in focus. A clean breakdown below this area would significantly weaken the structure and could trigger a deeper corrective phase.
On the flip side, bears would lose control if buyers manage to reclaim the 100-day moving average near $430. Such a move would signal renewed demand and could ease concerns tied to the descending triangle, at least in the short term.
Bottom Line
Zcash remains one of the most recognizable privacy-focused cryptocurrencies, but the current setup suggests caution. The combination of developer uncertainty and a bearish chart pattern has shifted momentum firmly in favor of sellers for now.
Until ZEC either breaks down from its descending triangle or reclaims key resistance levels, the token is likely to remain range-bound with a bearish tilt. How price behaves near the $300 support zone will be critical in defining Zcash’s next major move.
For traders and long-term holders alike, patience may be the best strategy as the market waits for clarity — both on the charts and within Zcash’s leadership structure.
Disclaimer: The views and analysis presented in this article are for informational purposes only and reflect the author’s perspective, not financial advice. Technical patterns and indicators discussed are subject to market volatility and may or may not yield the anticipated results. Investors are advised to exercise caution, conduct independent research, and make decisions aligned with their individual risk tolerance.
About Author: Nilesh Hembade is the Founder and Lead Author of Coinsprobe, with over 5 years of experience in the cryptocurrency and blockchain industry. Since launching Coinsprobe in 2023, he has been providing daily, research-driven insights through in-depth market analysis, on-chain data, and technical research.
Disclaimer: The information on this page may come from third parties and does not represent the views or opinions of Gate. The content displayed on this page is for reference only and does not constitute any financial, investment, or legal advice. Gate does not guarantee the accuracy or completeness of the information and shall not be liable for any losses arising from the use of this information. Virtual asset investments carry high risks and are subject to significant price volatility. You may lose all of your invested principal. Please fully understand the relevant risks and make prudent decisions based on your own financial situation and risk tolerance. For details, please refer to
Disclaimer.
Related Articles
Deutsche Bank Survey Shows US Bitcoin Adoption Rose to 12% in March, Up from 7% in February
Gate News message, April 21 — An investor survey by German banking giant Deutsche Bank revealed that cryptocurrency adoption in the US rose to 12% in March, up from a low of 7% in February, returning to levels projected for July 2025.
The report highlighted recovery in institutional demand as a
GateNews25m ago
Altcoins Surge Back Above $1.3T as Markets Rally After Greenland Crisis Resolution
On January 22, altcoins rebounded nearly 10% to $1.39 trillion due to eased global tensions, with Ethereum leading gains. Despite some volatility, the combined market cap stabilized at $1.32 trillion as other altcoins also showed modest recovery.
Coinpedia1h ago
ARB Recovery Gains Steam as Staking Yields Jump Above 221%
ARB rebounded 10% with strong volume and improving bullish market structure.
Staking yields rose above 221%, attracting more yield-focused investor interest.
Resistance near $0.14 remains key, with liquidity risks below current price.
Arbitrum — ARB, is showing renewed strength after a s
CryptoNewsLand1h ago
ETH and Altcoins Could See Parabolic Surge Upon Following Bullish Russell 2000 ATH Path
ETH and altcoins coils see parabolic surge upon following a bullish indicators.
The Russell 2000 just set a new ATH at 2,798 for the first time.
This new ATH indicator is a bullish signal for altcoins.
The crypto community is pleased to see that both BTC and ETH are trading at higher
CryptoNewsLand4h ago
Bitcoin Tops $75K as Ceasefire Hopes Drive Rally
Bitcoin rose on ETF demand while miners sold BTC; margins tightened and AI/HPC-focused pivots could turn miners into AI data-center players, potentially boosting valuations as AI demand grows.
Abstract: Bitcoin rose on ETF demand amid miner selling and tight margins. The report highlights a strategic pivot by public miners toward AI/HPC infrastructure, signaling a potential shift from pure bitcoin mining to AI data-center services and higher valuation multiples.
CryptoFrontier4h ago
Shiba Inu Sees 82.5B Token Outflow as Market Structure Shifts
Key Insights
Shiba Inu saw 82.5 billion tokens exit exchanges within 24 hours, signaling reduced supply pressure and increasing accumulation behavior among larger holders.
Exchange net flows remain positive as inflows persist, yet rising outflows suggest a gradual balance forming between
CryptoNewsLand4h ago
