
Key Takeaways
-
Fartcoin (FARTCOIN) is trading near $0.33 amid a broader crypto market sell-off driven by macro uncertainty.
-
The 4H chart shows a Bullish Bat harmonic pattern, often associated with short-term trend reversals.
-
Price has reacted positively from the D-point support near $0.288, hinting at seller exhaustion.
-
A breakout above the 50-period moving average around $0.374 could confirm bullish momentum.
-
Harmonic targets point toward $0.404 and $0.476 if the pattern plays out successfully.
-
A breakdown below $0.288 would invalidate the bullish setup.
As of January 19, 2026, Fartcoin (FARTCOIN) is trading slightly lower around $0.33, moving in line with the broader crypto market pullback. The sell-off was triggered by escalating US–EU trade tensions, which sparked nearly $875 million in long liquidations and pushed major assets like Bitcoin (BTC) and Ethereum (ETH) down more than 2% over the past 24 hours.
While FARTCOIN is down over 3% at the time of writing, the price action beneath the surface tells a more interesting story. The latest chart structure is now flashing a potential bullish harmonic setup, suggesting the current dip could be more of a setup than a breakdown.
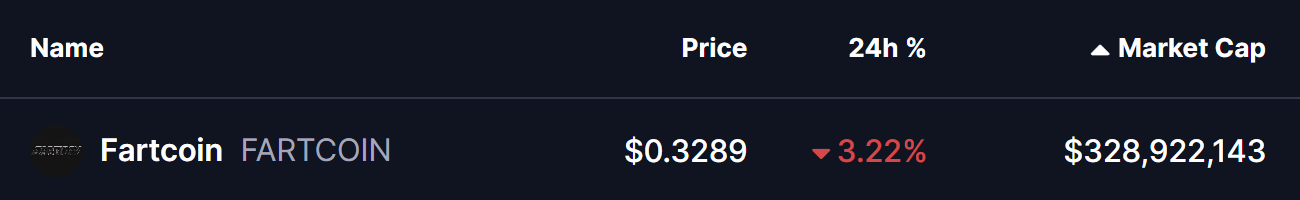
Source: Coinmarketcap
Harmonic Pattern Signals a Possible Reversal
On the 4-hour timeframe, Fartcoin is forming a well-defined Bullish Bat harmonic pattern, a structure often associated with short-term reversals after corrective phases.
The pattern began with the X point near $0.258, followed by a strong impulsive rally toward point A. Price then retraced to point B, rebounded to point C, and finally completed the structure at point D near $0.288. This D zone typically acts as the potential reversal area for the Bat pattern.
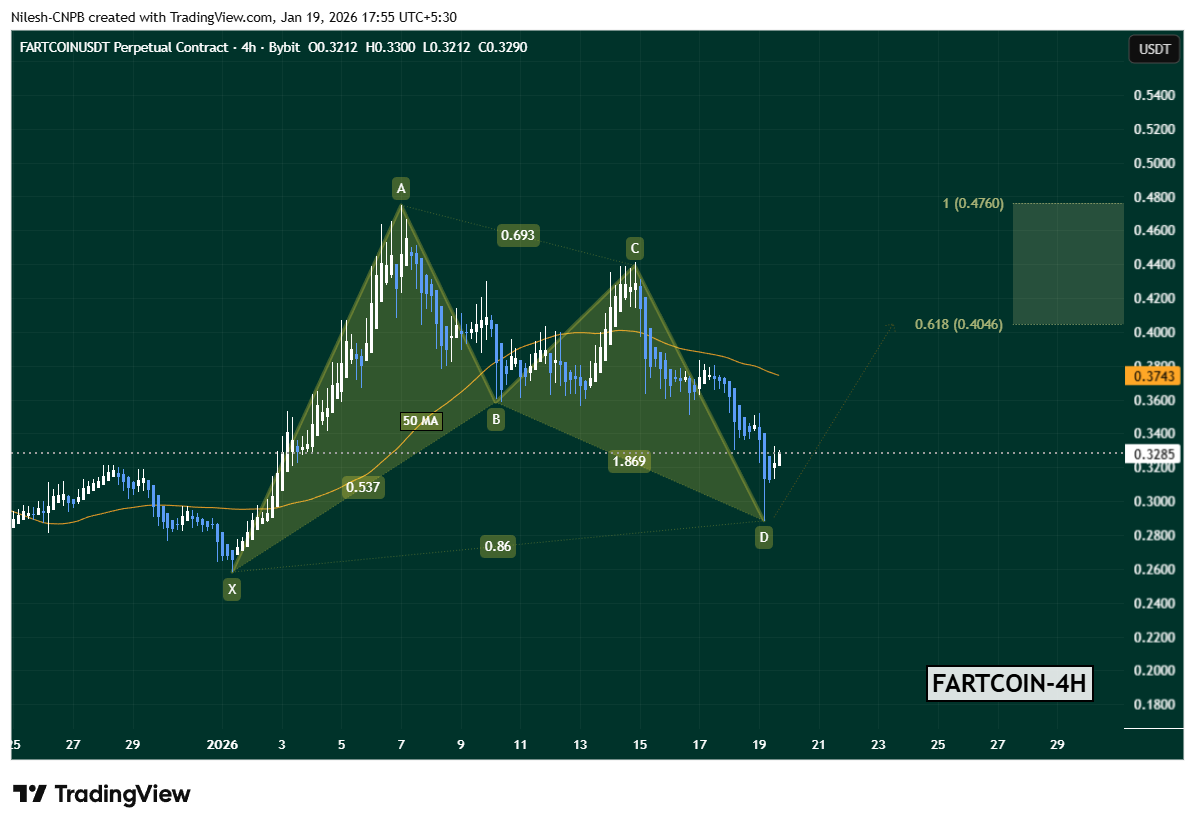
FARTCOIN Daily Chart/Coinsprobe (Source: Tradingview)
Following the completion of point D, FARTCOIN has already shown early signs of stabilization, bouncing back toward $0.3285. This initial reaction suggests that sellers may be losing momentum at current levels.
Key Levels That Could Decide the Move
One key level now in focus is the 50-period moving average, currently hovering around $0.3743. This level has acted as dynamic resistance in recent sessions and will likely determine whether the rebound gains traction or fades.
If buyers manage to push FARTCOIN above the 50 MA with improving volume, the harmonic projection opens the door for upside targets around:
This zone historically represents the area where Bat-pattern-driven moves tend to pause or face profit-taking.
On the flip side, the bullish setup remains valid only as long as price holds above the D-point support near $0.288. A decisive breakdown below this level would invalidate the harmonic structure and could expose FARTCOIN to deeper downside before any meaningful recovery attempt.
Bottom Line
Despite the ongoing market-wide weakness, Fartcoin’s chart is showing early signs of a technical rebound setup. The completion of a Bullish Bat harmonic pattern, combined with a developing bounce from key support, puts FARTCOIN at an important inflection point.
A breakout above the 50 MA could shift short-term momentum back in favor of the bulls, while failure to hold the D-point support would keep bears in control. For now, traders will be watching closely to see whether this harmonic signal translates into a sustained recovery or turns out to be another false start in a volatile market.
Disclaimer: The views and analysis presented in this article are for informational purposes only and reflect the author’s perspective, not financial advice. Technical patterns and indicators discussed are subject to market volatility and may or may not yield the anticipated results. Investors are advised to exercise caution, conduct independent research, and make decisions aligned with their individual risk tolerance.
About Author: Nilesh Hembade is the Founder and Lead Author of Coinsprobe, with over 5 years of experience in the cryptocurrency and blockchain industry. Since launching Coinsprobe in 2023, he has been providing daily, research-driven insights through in-depth market analysis, on-chain data, and technical research.
Disclaimer: The information on this page may come from third parties and does not represent the views or opinions of Gate. The content displayed on this page is for reference only and does not constitute any financial, investment, or legal advice. Gate does not guarantee the accuracy or completeness of the information and shall not be liable for any losses arising from the use of this information. Virtual asset investments carry high risks and are subject to significant price volatility. You may lose all of your invested principal. Please fully understand the relevant risks and make prudent decisions based on your own financial situation and risk tolerance. For details, please refer to
Disclaimer.
Related Articles
The Strait of Hormuz is fully reopened, and Bitcoin surged to 78K. MicroStrategy (MSTR) jumped 12%.
Iran announces that the Strait of Hormuz is fully open; oil prices fall sharply as supply concerns ease, and U.S. stock indexes hit record highs. Bitcoin once surged to $78,333 and lifted MicroStrategy’s stock price by 12% in a big jump. Market-wide sentiment improves, and cryptocurrencies also show signs of capital inflows.
ChainNewsAbmedia3h ago
BUY ALTCOINS NOW” — Altseason Index Signals Massive Pump Ahead, But Are These 4 Coins Worth the Risk?
The Altseason Index shows a compression pattern that often precedes strong market expansion.
XRP reflects stability, while Aptos and Sui show higher growth but increased volatility.
Pi remains speculative due to unclear liquidity and limited exchange presence.
The altcoin market is
CryptoNewsLand5h ago
XRP Rallies to $1.48 Amid Iran Deal and Ripple Banking News
XRP price rose to $1.48 on April 17, up 4.51% over the last 24 hours, as stronger trading activity, easing geopolitical tension, and Ripple-related banking developments supported sentiment, according to market data. Daily trading volume increased 14.35% to $4.52 billion, while the token's market
CryptoFrontier8h ago
Dogecoin Holds $0.09 Support as $0.10 Breakout Looms
Dogecoin remains around $0.09, showing limited movement as traders await a clear breakout direction. Key support is at $0.08, with resistance at $0.10. Current technical indicators suggest a balanced market, but a decisive move is needed to shift momentum.
CryptoNewsLand9h ago
Chainlink Holds Near $9 as Traders Eye Break Above Key Levels
Key Insights:
Chainlink holds near $9.13 as positive funding rates show bullish sentiment, yet declining open interest signals reduced trader participation and weaker conviction.
Price remains below major moving averages, with resistance between $9.16 and $9.26 limiting upside despite
CryptoNewsLand9h ago
Chainlink Price Compresses Below $10 as Breakout Pressure Builds
Key Insights
Chainlink maintains higher lows within a tightening range, reflecting steady accumulation as buyers absorb selling pressure and prepare for a potential breakout move
Repeated resistance tests near $10 weaken supply levels while rising support strengthens demand, increasing the p
CryptoNewsLand9h ago
