
SUI price has spent the last few weeks drifting lower, frustrating anyone watching the chart closely. Each small bounce faded quickly, and sellers kept control of the bigger picture. That slow grind lower has now pushed SUI price into a zone that matters, and the chart is starting to hint that something different could be forming.
Over the last 17 days alone, SUI price has dropped by more than 30%. That kind of move usually leaves a clear emotional footprint on the chart, especially when price approaches levels where buyers previously stepped in with confidence. That moment is getting closer.
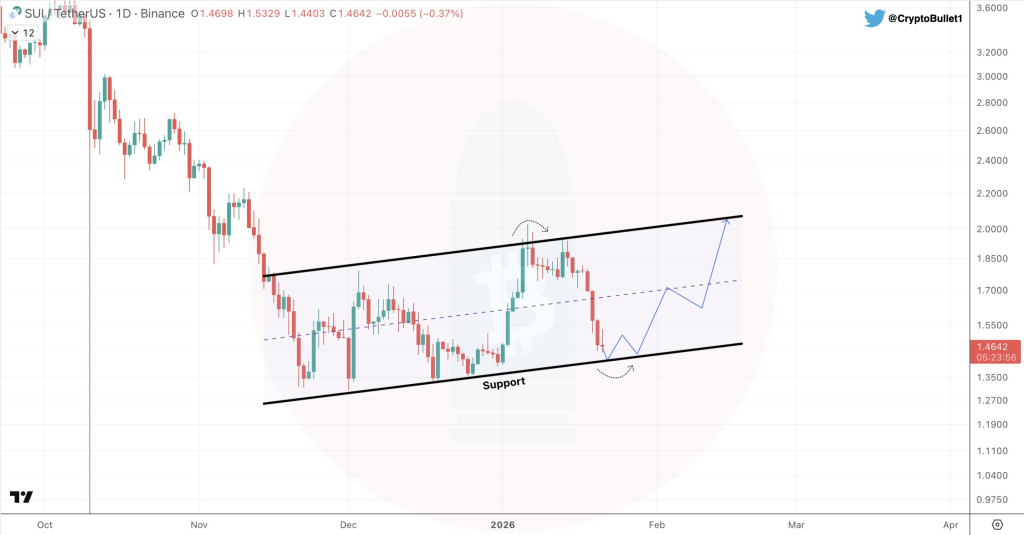
A tweet from a crypto analyst, Sui Insiders, has pointed out that SUI price is now back at daily support. That observation aligns with what the chart shows, as price sits near the lower channel boundary where buyers previously became active.
Current price action shows SUI price sliding back toward a zone where liquidity was absorbed in the past. That same area previously acted as a base before sharp upside moves. Price returning to such levels often forces the market to make a decision, either defending support again or breaking lower with momentum.
@SuiInsiders / X
The chart shows a potential bounce scenario toward $2.05, which aligns with the channel top. That target sits near the upper trendline, where price has been rejected multiple times before.
The attached chart helps visualize this setup clearly. SUI price is compressing near support, while the channel structure remains intact.
Price action shows long lower wicks forming near support, suggesting buyers are reacting even while the broader trend remains weak. That reaction alone does not confirm a reversal, yet it shows that sellers are no longer moving price freely.
SUI Indicators Still Point To Bearish Conditions Despite Support Holding
Technical indicators are still flashing caution across the board. Most momentum and trend indicators remain firmly in sell territory. That situation might look discouraging on the surface, yet indicators tend to lag price, especially during potential transition phases.
Price action remains the most real time signal, and it often shifts before indicators follow. That is why support reactions deserve attention even when indicators stay bearish.
Technical Indicator Snapshot For SUI
| Name |
| Value |
| Action |
| — |
| RSI(14) |
| 38.748 |
| Momentum remains weak, showing sellers still control strength levels |
| STOCH(9,6) |
| 20.492 |
| Oversold conditions persist without a confirmed reversal signal |
| MACD(12,26) |
| -0.023 |
| Trend momentum continues pointing lower with no bullish crossover |
| ADX(14) |
| 49.664 |
| Strong trend strength favors the existing bearish direction |
| ROC |
| -17.129 |
| Rate of change confirms negative momentum remains dominant |
These readings explain why caution still matters here. Indicators are not yet supporting a bullish shift, even though price is reacting at support.
Why Price Action Alone Is Not Enough To Call A Reversal For SUI
Price action offers valuable clues, yet relying on it alone carries risk. Strong reversals usually come with confirmation from multiple signals, including pattern development and improving indicator behavior. Waiting for signs such as higher lows, volume expansion, or indicator stabilization often reduces false signals.
Here’s the TAO Price If Bittensor Becomes the Backbone of Onchain AI_**
Support holds can fail, especially when broader market pressure remains heavy. A clean break below current support could open the door to deeper downside and shift the entire structure lower.
For now, SUI price sits at a crossroads. Support is being tested, indicators remain bearish, and the chart is asking an important question. The next reaction should reveal whether this level becomes a base or simply another pause before continuation.
Disclaimer: The information on this page may come from third parties and does not represent the views or opinions of Gate. The content displayed on this page is for reference only and does not constitute any financial, investment, or legal advice. Gate does not guarantee the accuracy or completeness of the information and shall not be liable for any losses arising from the use of this information. Virtual asset investments carry high risks and are subject to significant price volatility. You may lose all of your invested principal. Please fully understand the relevant risks and make prudent decisions based on your own financial situation and risk tolerance. For details, please refer to
Disclaimer.
Related Articles
Bitcoin falls below 71,500 USD, U.S.-Iran talks remain deadlocked, and the Strait of Hormuz becomes the biggest point of contention
On April 11, the U.S. and Iran began 20 hours of negotiations in Pakistan. The core issue was freedom of passage through the Strait of Hormuz. After Bitcoin briefly rose to $73,800, it quickly fell back to $71,557. The U.S. side took a hardline stance, demanding that Iran open the strait, while Iran insisted that easing restrictions must wait until a comprehensive agreement is reached. The two sides have not yet reached a consensus.
動區BlockTempo2h ago
Crypto Market Maintains Steady Growth Trajectory As Top Assets Show Gains
The crypto market continues to grow, with a market cap of $2.44T and Bitcoin and Ethereum showing slight increases. Top gainers include $GPM and $BASE. Meanwhile, DeFi TVL declined, NFT sales rose, and notable developments include a trader's significant loss and a push for regulatory clarity in Congress.
BlockChainReporter3h ago
BTC 15-minute chart slightly down 0.57%: leveraged long positions passively cut risk and macro sentiment disturbances drive volatility
2026-04-12 12:45 to 13:00 (UTC), the BTC price range was 71081.7 to 71493.2 USDT, with an amplitude of 0.58%. Within 15 minutes, the return recorded was -0.57%. During the period of unusual activity, market volatility increased somewhat, risk sentiment warmed up, and overall attention rose; however, there was no extreme surge in volume or a sudden drop in liquidity.
The main driver behind this unusual activity is that, under the leverage structure, long positions were reduced passively. Recently, the funding rate for perpetual contracts turned from negative to positive. Leverage among longs in the market accumulated; the price dipped slightly, triggering liquidations of some leveraged long positions and sell orders for position closures, resulting in
GateNews5h ago
Analyst: Bitcoin’s current pullback is relatively mild compared with past ones, but the bottom has not been confirmed yet.
Crypto analyst Axel Adler Jr said the current Bitcoin pullback is smaller than historic bearish-market levels, but a bottom has not yet been confirmed. He believes the market is still in a mild bear phase, and that a true recovery will require patience and waiting.
GateNews6h ago
Bitcoin long-term holdings increased to 12.4 million coins, and the 30-day change has remained positive.
CryptoQuant analyst Darkfost says the Bitcoin market is entering an early stabilization phase, with stronger long-term holding behavior. The amount of BTC held for more than a year has increased, and investors are more inclined to hold than to distribute. This suggests the market is transitioning toward long-term conviction; the current trend is viewed as an early stability signal, but it needs longer-term confirmation.
GateNews8h ago
XRP Payments Fall 77% as Price Eyes End to Rally - U.Today
XRP's on-chain payment volume has dropped 77% to 86 million, signaling bearish momentum as its price stagnates below $1.35. This decline has raised investor concerns about potential volatility in the crypto market.
UToday10h ago
