
Key Takeaways
-
Zcash (ZEC) is trading near the $396–$397 range after losing momentum following a sharp 2025 rally.
-
The resignation of Zcash’s core development team triggered strong selling pressure and weakened market confidence.
-
The daily chart shows a descending triangle, a bearish continuation pattern signaling increasing seller control.
As of January 18, 2026,** Zcash (ZEC) **is trading around the $396–$397 range, extending its recent weakness with a nearly 2.5% drop over the last 24 hours. While the move may look modest on the surface, it reflects a broader shift in sentiment following ZEC’s explosive 2025 rally, where the privacy-focused coin surged more than 800% at its peak.
That momentum has clearly faded in early 2026, and both fundamentals and technicals are now flashing caution signals.
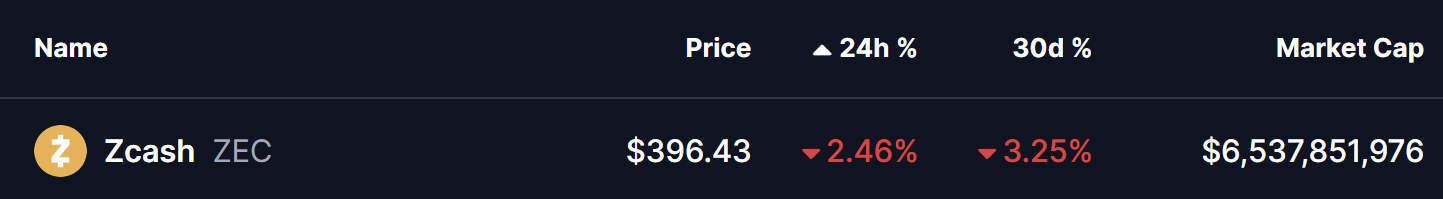
Source: Coinmarketcap
Developer Exodus Shakes Confidence
The biggest overhang for Zcash came earlier this month when the entire core development team at Electric Coin Company (ECC) stepped down. The resignations, which occurred around January 7–8, were linked to governance disputes with the Bootstrap nonprofit board overseeing the project.
Markets reacted swiftly. ZEC sold off sharply from the $480–$500 region, erasing weeks of gains in a matter of days. For a project built around long-term cryptographic research and privacy innovation, uncertainty around leadership and development direction has weighed heavily on investor confidence.
Descending Triangle Takes Shape
From a technical standpoint, Zcash’s daily chart now shows a clear descending triangle, a structure that typically signals bearish continuation after a strong uptrend.
The pattern is defined by:
-
A flat support zone between $300 and $335, which has repeatedly attracted buyers.
-
A series of lower highs, forming a downward-sloping resistance line from the 2025 peak near $750.
As price compresses within this triangle, volatility has steadily declined — often a precursor to a decisive move. Adding to the bearish bias, the 100-day moving average continues to cap upside attempts, acting as dynamic resistance during recent rebounds.
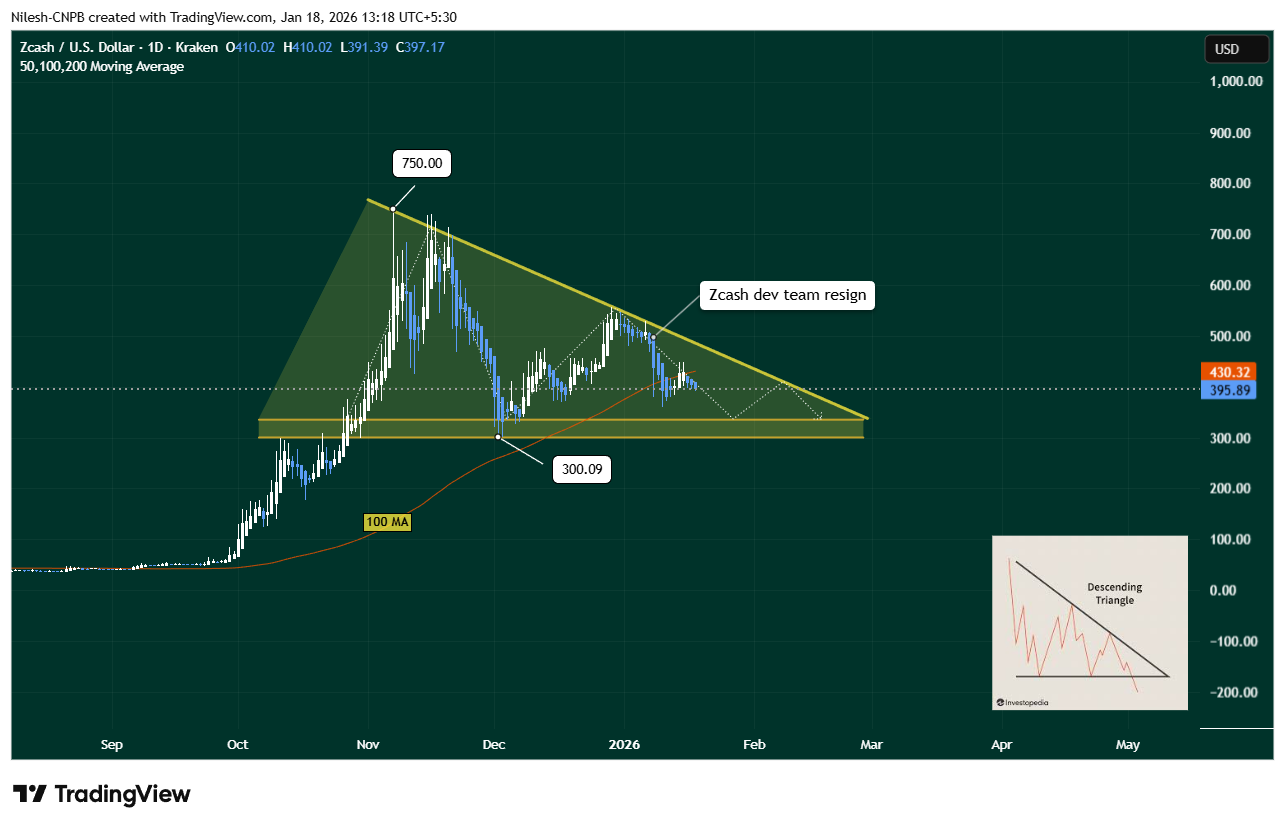
Zcash (ZEC) Daily Chart/Coinsprobe (Source: Tradingview)
The chart also highlights how the sharp sell-off began almost immediately after the developer resignation news, reinforcing the connection between fundamentals and technical weakness.
What’s Next for ZEC?
If bearish pressure persists, ZEC could gradually slide toward the lower boundary of the triangle, putting the $300–$335 support zone back in focus. A clean breakdown below this area would significantly weaken the structure and could trigger a deeper corrective phase.
On the flip side, bears would lose control if buyers manage to reclaim the 100-day moving average near $430. Such a move would signal renewed demand and could ease concerns tied to the descending triangle, at least in the short term.
Bottom Line
Zcash remains one of the most recognizable privacy-focused cryptocurrencies, but the current setup suggests caution. The combination of developer uncertainty and a bearish chart pattern has shifted momentum firmly in favor of sellers for now.
Until ZEC either breaks down from its descending triangle or reclaims key resistance levels, the token is likely to remain range-bound with a bearish tilt. How price behaves near the $300 support zone will be critical in defining Zcash’s next major move.
For traders and long-term holders alike, patience may be the best strategy as the market waits for clarity — both on the charts and within Zcash’s leadership structure.
Disclaimer: The views and analysis presented in this article are for informational purposes only and reflect the author’s perspective, not financial advice. Technical patterns and indicators discussed are subject to market volatility and may or may not yield the anticipated results. Investors are advised to exercise caution, conduct independent research, and make decisions aligned with their individual risk tolerance.
About Author: Nilesh Hembade is the Founder and Lead Author of Coinsprobe, with over 5 years of experience in the cryptocurrency and blockchain industry. Since launching Coinsprobe in 2023, he has been providing daily, research-driven insights through in-depth market analysis, on-chain data, and technical research.
Disclaimer: The information on this page may come from third parties and does not represent the views or opinions of Gate. The content displayed on this page is for reference only and does not constitute any financial, investment, or legal advice. Gate does not guarantee the accuracy or completeness of the information and shall not be liable for any losses arising from the use of this information. Virtual asset investments carry high risks and are subject to significant price volatility. You may lose all of your invested principal. Please fully understand the relevant risks and make prudent decisions based on your own financial situation and risk tolerance. For details, please refer to
Disclaimer.
Related Articles
XRP Today’s News: Institutional funds return, circulating inflow of 120 million exceeds Bitcoin
This week, XRP recorded a $119.6 million capital inflow, setting the highest mark since 2025 and becoming a major beneficiary in the crypto market. This round of funds returning was mainly driven by greater clarity in regulatory policy and XRP’s real-world use in cross-border payment infrastructure. Technically, it shows an initial recovery, but overall it is still in a downward channel. The support and resistance levels are $1.31 and $1.40, respectively; if it breaks through, it is expected to reach $1.50.
MarketWhisper1h ago
XRP drops to $1.33, with $3.32 million in ETF inflows still failing to reverse the downtrend; the key support to watch is $1.28
In April 2026, the XRP price pulled back to $1.33, down about 4%. Although there was capital inflow into Ripple-related products, selling pressure dominated the market, and increased trading volume signaled distribution. Declining liquidity further heightens volatility risk; watch the $1.33 support—if it breaks, prices will likely fall further. For a short-term rebound, it needs to break above $1.35; otherwise, it should remain in a weak range-bound consolidation.
GateNews2h ago
XRP Price Structure Signals More Downside — Key Levels to Watch
XRP fails to make new highs, confirming bearish market structure remains intact.
Price targets $1.13, $1.08, and potentially $0.87 support levels.
Traders should wait for confirmation instead of reacting to short-term price moves.
Short bursts of green candles can quickly shift market
CryptoNewsLand2h ago
Bitcoin is hovering around the $700,000 level; if oil prices fall below $100 or push toward $80,000
Bitcoin has recently been trading in a high-level range. The price rebounded from $67,000 to $70,900, driven by a U.S.-Iran ceasefire agreement. Market analysis suggests that weakness in oil prices—or easing inflation pressure—may support Bitcoin’s upside. If it breaks above $72,500, it could trigger short liquidations and push the price up to $80,000. However, instability in the Middle East and a rebound in oil prices could act as a drag. Volatility in the energy market will be a key factor influencing Bitcoin’s direction.
GateNews2h ago
Tom Lee: The stock market often hits bottom early in a war, bullish on Ethereum and tech stocks
Well-known analyst Tom Lee said in an interview that despite the U.S.-Iran conflict and rising oil prices, the stock market did not fall, showing that the market has strong resilience. He believes that most S&P constituents have undergone significant adjustments, that the worst-case scenario for the overall market may already be behind us, and that there is room for upside from here. He is bullish on Ethereum as well as technology, industrial, and mid- and small-cap stocks.
GateNews3h ago
Michael Saylor: Bitcoin may have already hit bottom, but quantum risks have been exaggerated
Strategy Executive Chairman Michael Saylor believes Bitcoin hit its bottom around $60,000 this February, because all forced sellers in the market have already exited. He said that the catalyst for the next bull market will be a bitcoin-based banking credit system, while he believes the threat from quantum computing is being exaggerated, and he pointed out that the technical community has enough time to deal with this threat.
MarketWhisper5h ago
