
Key Takeaways:
-
Ondo (ONDO) is trading near a critical support zone around $0.32 after a sharp market-wide sell-off.
-
The daily chart shows a right-angled descending broadening wedge, a pattern often linked to potential bullish reversals.
-
Buyers are defending the lower wedge boundary, suggesting selling pressure may be weakening.
-
The 100-day moving average near $0.53 remains a major resistance that must be reclaimed for trend reversal confirmation.
-
A successful rebound could open the door for a recovery toward the $1.10–$1.17 resistance zone, while a breakdown below $0.32 would invalidate the bullish setup.
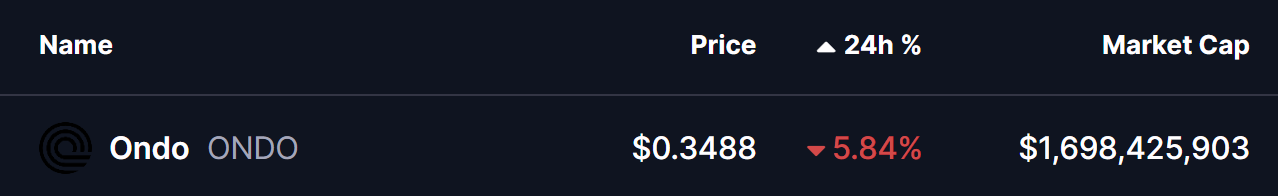
The real-world asset (RWA) token Ondo (ONDO) is trading under pressure near $0.35, extending its short-term downtrend amid a broader crypto market sell-off. The latest wave of weakness follows escalating US–EU trade tensions, which sparked over $851 million in long liquidations, dragging major assets like Bitcoin (BTC) and Ethereum (ETH) down by roughly 2.5% and 4.5%, respectively, over the past 24 hours.
ONDO itself is down 5.98% at the time of writing. However, despite the bearish momentum, the daily chart suggests price is approaching a technically important zone where a potential rebound setup could begin to form.
Source: Coinmarketcap
Right-Angled Descending Broadening Wedge in Focus
From a technical perspective, Ondo’s daily chart is carving out a right-angled descending broadening wedge, a pattern that often appears during extended corrective phases and can precede bullish reversals if support holds.
This structure has been developing since ONDO’s rejection from the neckline resistance zone around $1.00–$1.17 back in September 2025. Since then, price has continued to print lower highs while gradually expanding volatility, pushing ONDO down toward the lower boundary of the wedge near $0.32.
Notably, selling pressure appears to be easing near this zone. Buyers have stepped in to defend the level, with ONDO currently hovering slightly above it around $0.348 — a sign that demand may be emerging after weeks of sustained downside.
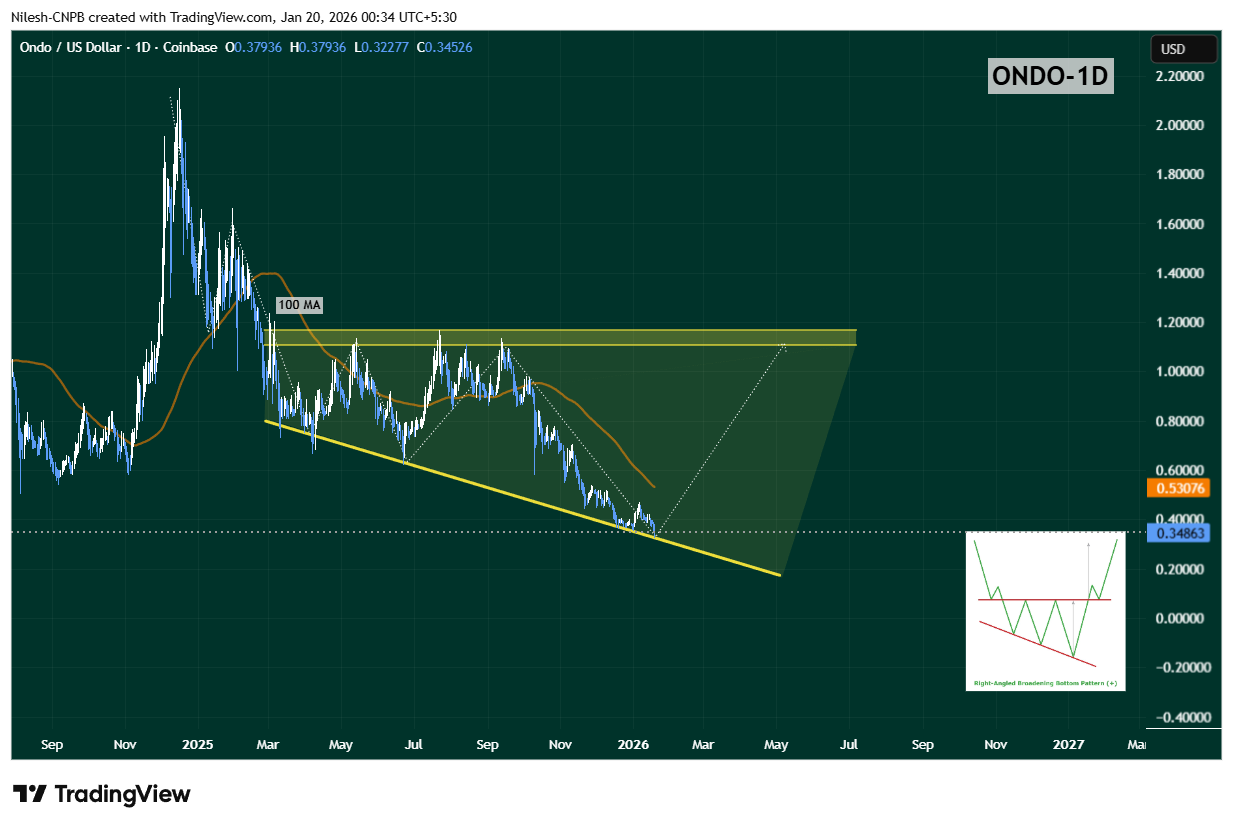
Ondo (ONDO) Daily Chart/Coinsprobe (Source: Tradingview)
While the lower wedge support is holding for now, upside momentum remains constrained. The 100-day moving average, currently positioned near $0.53, has flipped into strong overhead resistance. Each prior rally attempt has stalled below this level, reinforcing its importance as a confirmation point for any meaningful trend reversal.
Until ONDO can reclaim this moving average, any bounce should be viewed as a relief rally within a broader consolidation, rather than a confirmed rebound.
What’s Next for ONDO?
As long as ONDO continues to defend the $0.32 support zone, the right-angled descending broadening wedge remains technically valid. Sustained holding above this level keeps the door open for a rebound attempt, particularly if price begins forming higher daily or weekly closes.
A successful reclaim of the 50-day moving average, followed by a breakout above the 100-day MA, would mark a clear shift in momentum. If that scenario unfolds, ONDO could gradually work its way back toward the upper boundary of the wedge, which currently aligns near the $1.10–$1.17 region — a level that would represent a significant recovery from current prices.
On the flip side, a decisive breakdown below $0.32 would invalidate the bullish wedge structure and likely expose ONDO to another leg of downside or prolonged consolidation.
Bottom Line
Ondo is currently sitting at a critical technical crossroads. While broader market sentiment remains fragile, the chart suggests ONDO is testing a zone where seller exhaustion could give way to a bounce. The next few sessions will be crucial. How price reacts around the lower wedge support will likely determine whether ONDO can stage a meaningful rebound — or whether bears retain control for longer.
Disclaimer: The views and analysis presented in this article are for informational purposes only and reflect the author’s perspective, not financial advice. Technical patterns and indicators discussed are subject to market volatility and may or may not yield the anticipated results. Investors are advised to exercise caution, conduct independent research, and make decisions aligned with their individual risk tolerance.
About Author: Nilesh Hembade is the Founder and Lead Author of Coinsprobe, with over 5 years of experience in the cryptocurrency and blockchain industry. Since launching Coinsprobe in 2023, he has been providing daily, research-driven insights through in-depth market analysis, on-chain data, and technical research.
Disclaimer: The information on this page may come from third parties and does not represent the views or opinions of Gate. The content displayed on this page is for reference only and does not constitute any financial, investment, or legal advice. Gate does not guarantee the accuracy or completeness of the information and shall not be liable for any losses arising from the use of this information. Virtual asset investments carry high risks and are subject to significant price volatility. You may lose all of your invested principal. Please fully understand the relevant risks and make prudent decisions based on your own financial situation and risk tolerance. For details, please refer to
Disclaimer.
Related Articles
BSC Chinese meme coins surge across the board, as CZ’s tweet sparks a “Crypto Summer” craze
On April 13, Chinese meme coins across the BSC chain rose across the board, led by “Binance Life,” with a weekly gain of up to 360% and an intraday increase of over 45%. CZ’s post sparked resonance with “Crypto Summer,” energizing sentiment across the entire sector. Although market sentiment has surged in the short term, the high volatility and liquidity risks of meme coins cannot be ignored, and investors need to be cautious.
MarketWhisper45m ago
Bittensor founder accuses former brother of betrayal; TAO’s sudden plunge sparks 9.1 million liquidations
Bittensor co-founder Jacob Steeves accuses Covenant AI’s Simon Dare of intentionally causing damage to the agreement, leading to a sharp drop in TAO tokens. Steeves proposes a locked-staking mechanism that uses on-chain code to enforce commitments and prevent founders from making sudden, surprise exits. Even as the crisis unfolds, Bittensor’s open-source architecture can still ensure the agreement continues to operate, and it is set to hold a meeting to introduce the new mechanism.
MarketWhisper1h ago
Bloomberg strategist Mike McGlone: a crypto bear market or at the early stage, with Bitcoin potentially falling back to $10k
Bloomberg strategist Mike McGlone says the crypto bear market may be in its early stages, and Bitcoin could fall to $10k. Even though Bitcoin ETFs have matched S&P 500 ETF returns, Bitcoin ETFs have higher volatility and the valuation of underlying assets that lack real support remains elevated.
GateNews1h ago
Why is Bitcoin down today? The U.S. military blocks the Strait of Hormuz, but Iran-U.S. talks end in failure
The U.S. imposes a naval blockade on Iran, causing the U.S.-Iran nuclear talks to fall apart. Market risk sentiment intensifies, and Bitcoin drops to $71,000, with a 24-hour decline of 3.1%. Traditional market capital flows into safe-haven assets, and analysts are divided on Bitcoin’s future trend, with $70,000 support acting as a key level.
MarketWhisper2h ago
The Crypto Fear and Greed Index drops to 12, and the market is in extreme fear
Gate News message, April 13. According to Alternative.me data, today the Crypto Fear and Greed Index is 12, down further from yesterday’s 16, with the market in an “extreme fear” state. This index evaluates market sentiment across multiple dimensions, including volatility, market trading volume, social media, market surveys, Bitcoin’s share of the overall market, and Google Trends keyword analysis. The lower the number, the greater the level of fear.
GateNews2h ago
ETH 15-minute drop of 0.66%: short-term holders selling off in tandem with exchange net inflows amplifies the selling pressure
2026-04-12 22:00 to 22:15 (UTC), ETH showed a clear downward move in a highly liquid environment. The candlestick chart indicates a return of -0.66%, with price fluctuations ranging from 2186.76 to 2211.25 USDT, and a swing amplitude of 1.11%. Market attention rose rapidly, short-term sentiment turned cautious, and volatility intensified.
The main driving factors behind this unusual move are a sharp increase in exchange net inflows and concentrated selling by short-term holders. On-chain data shows that over the past 24 hours, net inflow of ETH into exchanges totaled 9,567.65 ETH, suggesting that a large amount of capital entered the market in the short term, potentially increasing selling pressure.
GateNews5h ago
