
Key Takeaways
-
Solana (SOL) is under short-term pressure as the broader crypto market faces heavy liquidation-driven selling.
-
The daily chart suggests a potential inverted head and shoulders pattern, a classic bullish reversal structure.
-
The $123 zone is acting as a critical support area where buyers have previously stepped in.
-
SOL remains below the 50-day moving average near $132.65, which is a key resistance level for bulls.
-
A reclaim of the 50-day MA could open the door for a move toward the $142–$147 neckline resistance.
-
A breakdown below the $126–$121 region would invalidate the bullish setup and increase downside risk.
**Solana (SOL) **is trading in the red as the broader crypto market remains under pressure over the past 48 hours. Risk sentiment has turned cautious once again, with Bitcoin (BTC) slipping below the $90,000 mark and Ethereum (ETH) tumbling nearly 7% in the last 24 hours. This sharp move triggered more than $689 million in liquidations, with long positions accounting for roughly $629 million of the damage.
Amid this market-wide sell-off, SOL has dropped over 5%. However, beneath the red candles, Solana’s daily chart is beginning to hint at a potential technical setup that could shape its next move.
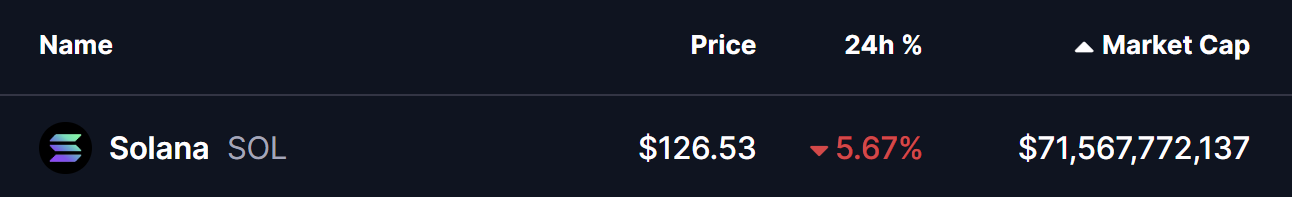
Source: Coinmarketcap
Emerging Inverted Head and Shoulders Pattern
On the daily timeframe, Solana appears to be forming a possible inverted head and shoulders pattern, one of the more reliable bullish reversal structures when confirmed.
-
The left shoulder formed in late November around the $123 zone.
-
Price then sold off more deeply to create the head near $119, marking a local capitulation low.
-
The latest rejection from the neckline resistance zone between $142 and $147 has pushed SOL lower again, with price now drifting back toward the $123 area. This move is shaping what could become the right shoulder.
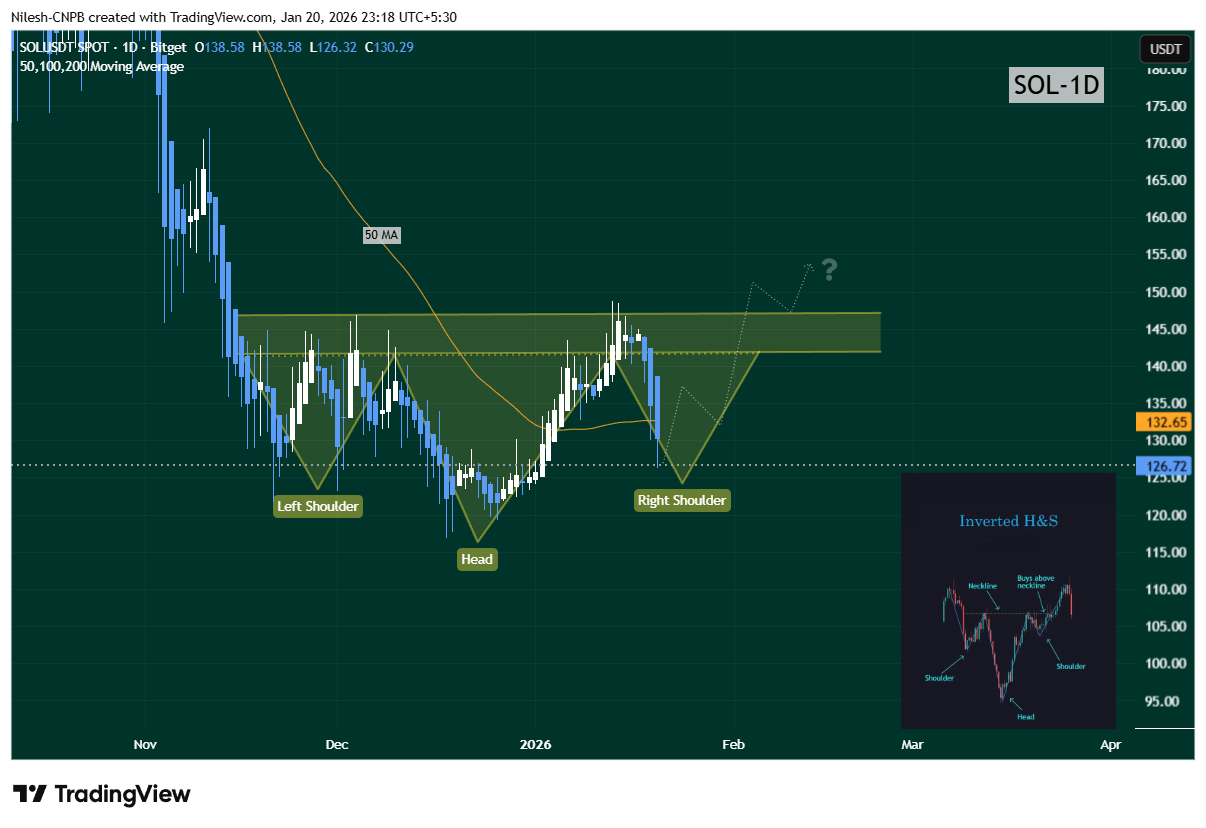
Solana (SOL) Daily Chart/Coinsprobe (Source: Tradingview)
This structure suggests that sellers may be losing momentum after repeated attempts to push price lower, while buyers continue to defend the same demand zone.
Key Resistance Still Overhead
Despite the developing pattern, SOL is still trading below its 50-day moving average, currently positioned near $132.65. This moving average has flipped into a key overhead resistance and remains a crucial level for bulls to reclaim. As long as SOL stays below this line, upside attempts may struggle to gain traction.
What’s Next for SOL?
If the inverted head and shoulders pattern continues to develop, SOL could find support near the $123 region, completing the right shoulder and setting the stage for a rebound. A successful push back above the 50-day moving average would be an early bullish signal and could open the door for a renewed move toward the neckline resistance zone at $142–$147.
A decisive breakout above this neckline sees the pattern confirmed and could trigger a short-term bullish rally as momentum traders step back in.
On the flip side, the bullish setup remains vulnerable. A breakdown below the $126–$121 support zone would invalidate the inverted head and shoulders structure and increase the risk of further downside.
Outlook
For now, Solana sits at a technical crossroads. While broader market weakness continues to weigh on price, the developing chart structure suggests that selling pressure may be fading. Traders will be watching closely to see whether SOL can hold the $123 support and reclaim the 50-day moving average — a move that could turn this dip into a potential rebound opportunity.
Disclaimer: The views and analysis presented in this article are for informational purposes only and reflect the author’s perspective, not financial advice. Technical patterns and indicators discussed are subject to market volatility and may or may not yield the anticipated results. Investors are advised to exercise caution, conduct independent research, and make decisions aligned with their individual risk tolerance.
About Author: Nilesh Hembade is the Founder and Lead Author of Coinsprobe, with over 5 years of experience in the cryptocurrency and blockchain industry. Since launching Coinsprobe in 2023, he has been providing daily, research-driven insights through in-depth market analysis, on-chain data, and technical research.
Disclaimer: The information on this page may come from third parties and does not represent the views or opinions of Gate. The content displayed on this page is for reference only and does not constitute any financial, investment, or legal advice. Gate does not guarantee the accuracy or completeness of the information and shall not be liable for any losses arising from the use of this information. Virtual asset investments carry high risks and are subject to significant price volatility. You may lose all of your invested principal. Please fully understand the relevant risks and make prudent decisions based on your own financial situation and risk tolerance. For details, please refer to
Disclaimer.
Related Articles
ETH/BTC Price Ratio Rebounds to 0.0313 in Q1 2026 as Ethereum User Base Surges 82%
In Q1 2026, the Ethereum-to-Bitcoin price ratio reached a three-month high at 0.0313. Ethereum added 284,000 users and surpassed $180 billion in stablecoin supply. Bitcoin remained strong above $74,000, driven by significant ETF inflows.
GateNews3h ago
Why is Bitcoin up today? Trump says Iran is seeking a truce, and risk assets move higher across the board
On April 15, Bitcoin rebounded about 6% after Trump said Iran is seeking to reach an agreement, breaking above $75,000. Expectations for the resumption of U.S.-Iran negotiations warmed up, lifting Asian stock markets. Technically, roughly $6 billion worth of short positions were forced to close, accelerating the rebound. Analysts said that if the U.S.-Iran situation continues to ease, Bitcoin could break through $80,000, and they predicted it may reach $150,000 by year-end.
MarketWhisper7h ago
Bitmine is promoted to the NYSE main board! Tom Lee: US stocks may be at a bottom, and selling pressure on Ether could ease
Bitmine officially transferred from the NYSE American market to the main board, marking a significant milestone for the company. Despite a sharp drop in its share price, it still increased the share repurchase program to $4 billion. The company holds a large amount of Ether, and expects that a rebound in the crypto market will help improve its assets and share price performance.
CryptoCity7h ago
ETH 15-minute up 0.66%: On-chain large transfers in sync drove a net inflow of funds, boosting spot buying pressure
2026-04-15 00:00 to 00:15 (UTC), ETH shows a local anomaly. The 15-minute return rate is +0.66%. The trading price range is 2321.93–2343.2 USDT, with a range of 0.92%. During this period, market attention increased, volatility slightly intensified, buy pressure in the order book shifted upward in the short term, and quickly pushed spot prices up into a key resistance area.
The main drivers of this anomaly are large on-chain transfers and inflows of capital in combination. At the beginning of the window, multiple large ETH transfers appeared, including 8,676 ETH and 6,551 ETH, respectively, transferring from a large source to the
GateNews8h ago
BTC 15-minute drop of 0.54%: Liquidity worsens and whales actively reduce positions, putting short-term pressure on the market
From 22:15 to 22:30 (UTC) on 2026-04-14, BTC saw a short-term pullback of 0.54% within the high-range band of 73911.6 - 74314.4 USDT, with a return of -0.54%. During this period, market swings were evident, volatility intensified, attention from the market quickly increased, and downward pressure on the order book was prominent.
The main drivers behind this unusual move were the continued deterioration of market liquidity and a clear lack of order book depth, which made the BTC price extremely sensitive to large sell orders. At the same time, during the key time window, whale wallets carried out large transfers and also engaged in active de-risking,
GateNews9h ago
ETH 15-minute drop of 0.61%: Sell orders concentrate and release while bearish sentiment intensifies, increasing downward pressure
2026-04-14 22:15 to 2026-04-14 22:30 (UTC) during this period, on the 15-minute K-line, ETH recorded a -0.61% return, with a price range of 2313.68 to 2328.54 USDT and a fluctuation of 0.64%. During this period, market attention increased, trading volume expanded noticeably, and heightened short-term volatility sparked strong interest in the subsequent trend.
The main drivers behind this unusual move are the concentrated release of sell orders and continued net outflows of on-chain funds. Specifically, the sell volume share rose to 52%, higher than the buy side at 48%, indicating heavy selling pressure
GateNews9h ago
