
Key Takeaways
-
Near Protocol (NEAR) is gaining momentum, with price up nearly 18% over the past 30 days.
-
The daily chart shows a well-defined inverse head and shoulders pattern, signaling a potential bullish reversal.
-
NEAR is consolidating just below a key neckline resistance zone between $1.79 and $1.88.
-
Reclaiming the 100-day moving average near $1.96 would strengthen the bullish breakout case.
-
A confirmed breakout could open the door toward the $2.36 upside target.
-
Failure to hold above the $1.65 support zone may lead to further consolidation and delay the bullish setup.
The cryptocurrency market’s AI narrative has been gaining renewed traction, and Near Protocol (NEAR) is emerging as one of the standout performers. Over the past 30 days, NEAR has surged nearly 18%, and beyond the price action, the project continues to strengthen fundamentally.
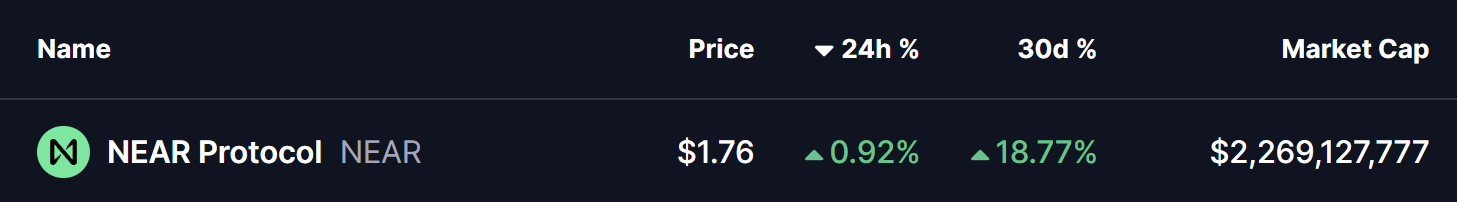
Source: Coinmarketcap
NEAR currently ranked as the third most active blockchain by 38.9 monthly users, trailing only BNB Chain and Solana — a signal that on-chain usage and developer activity remain strong.
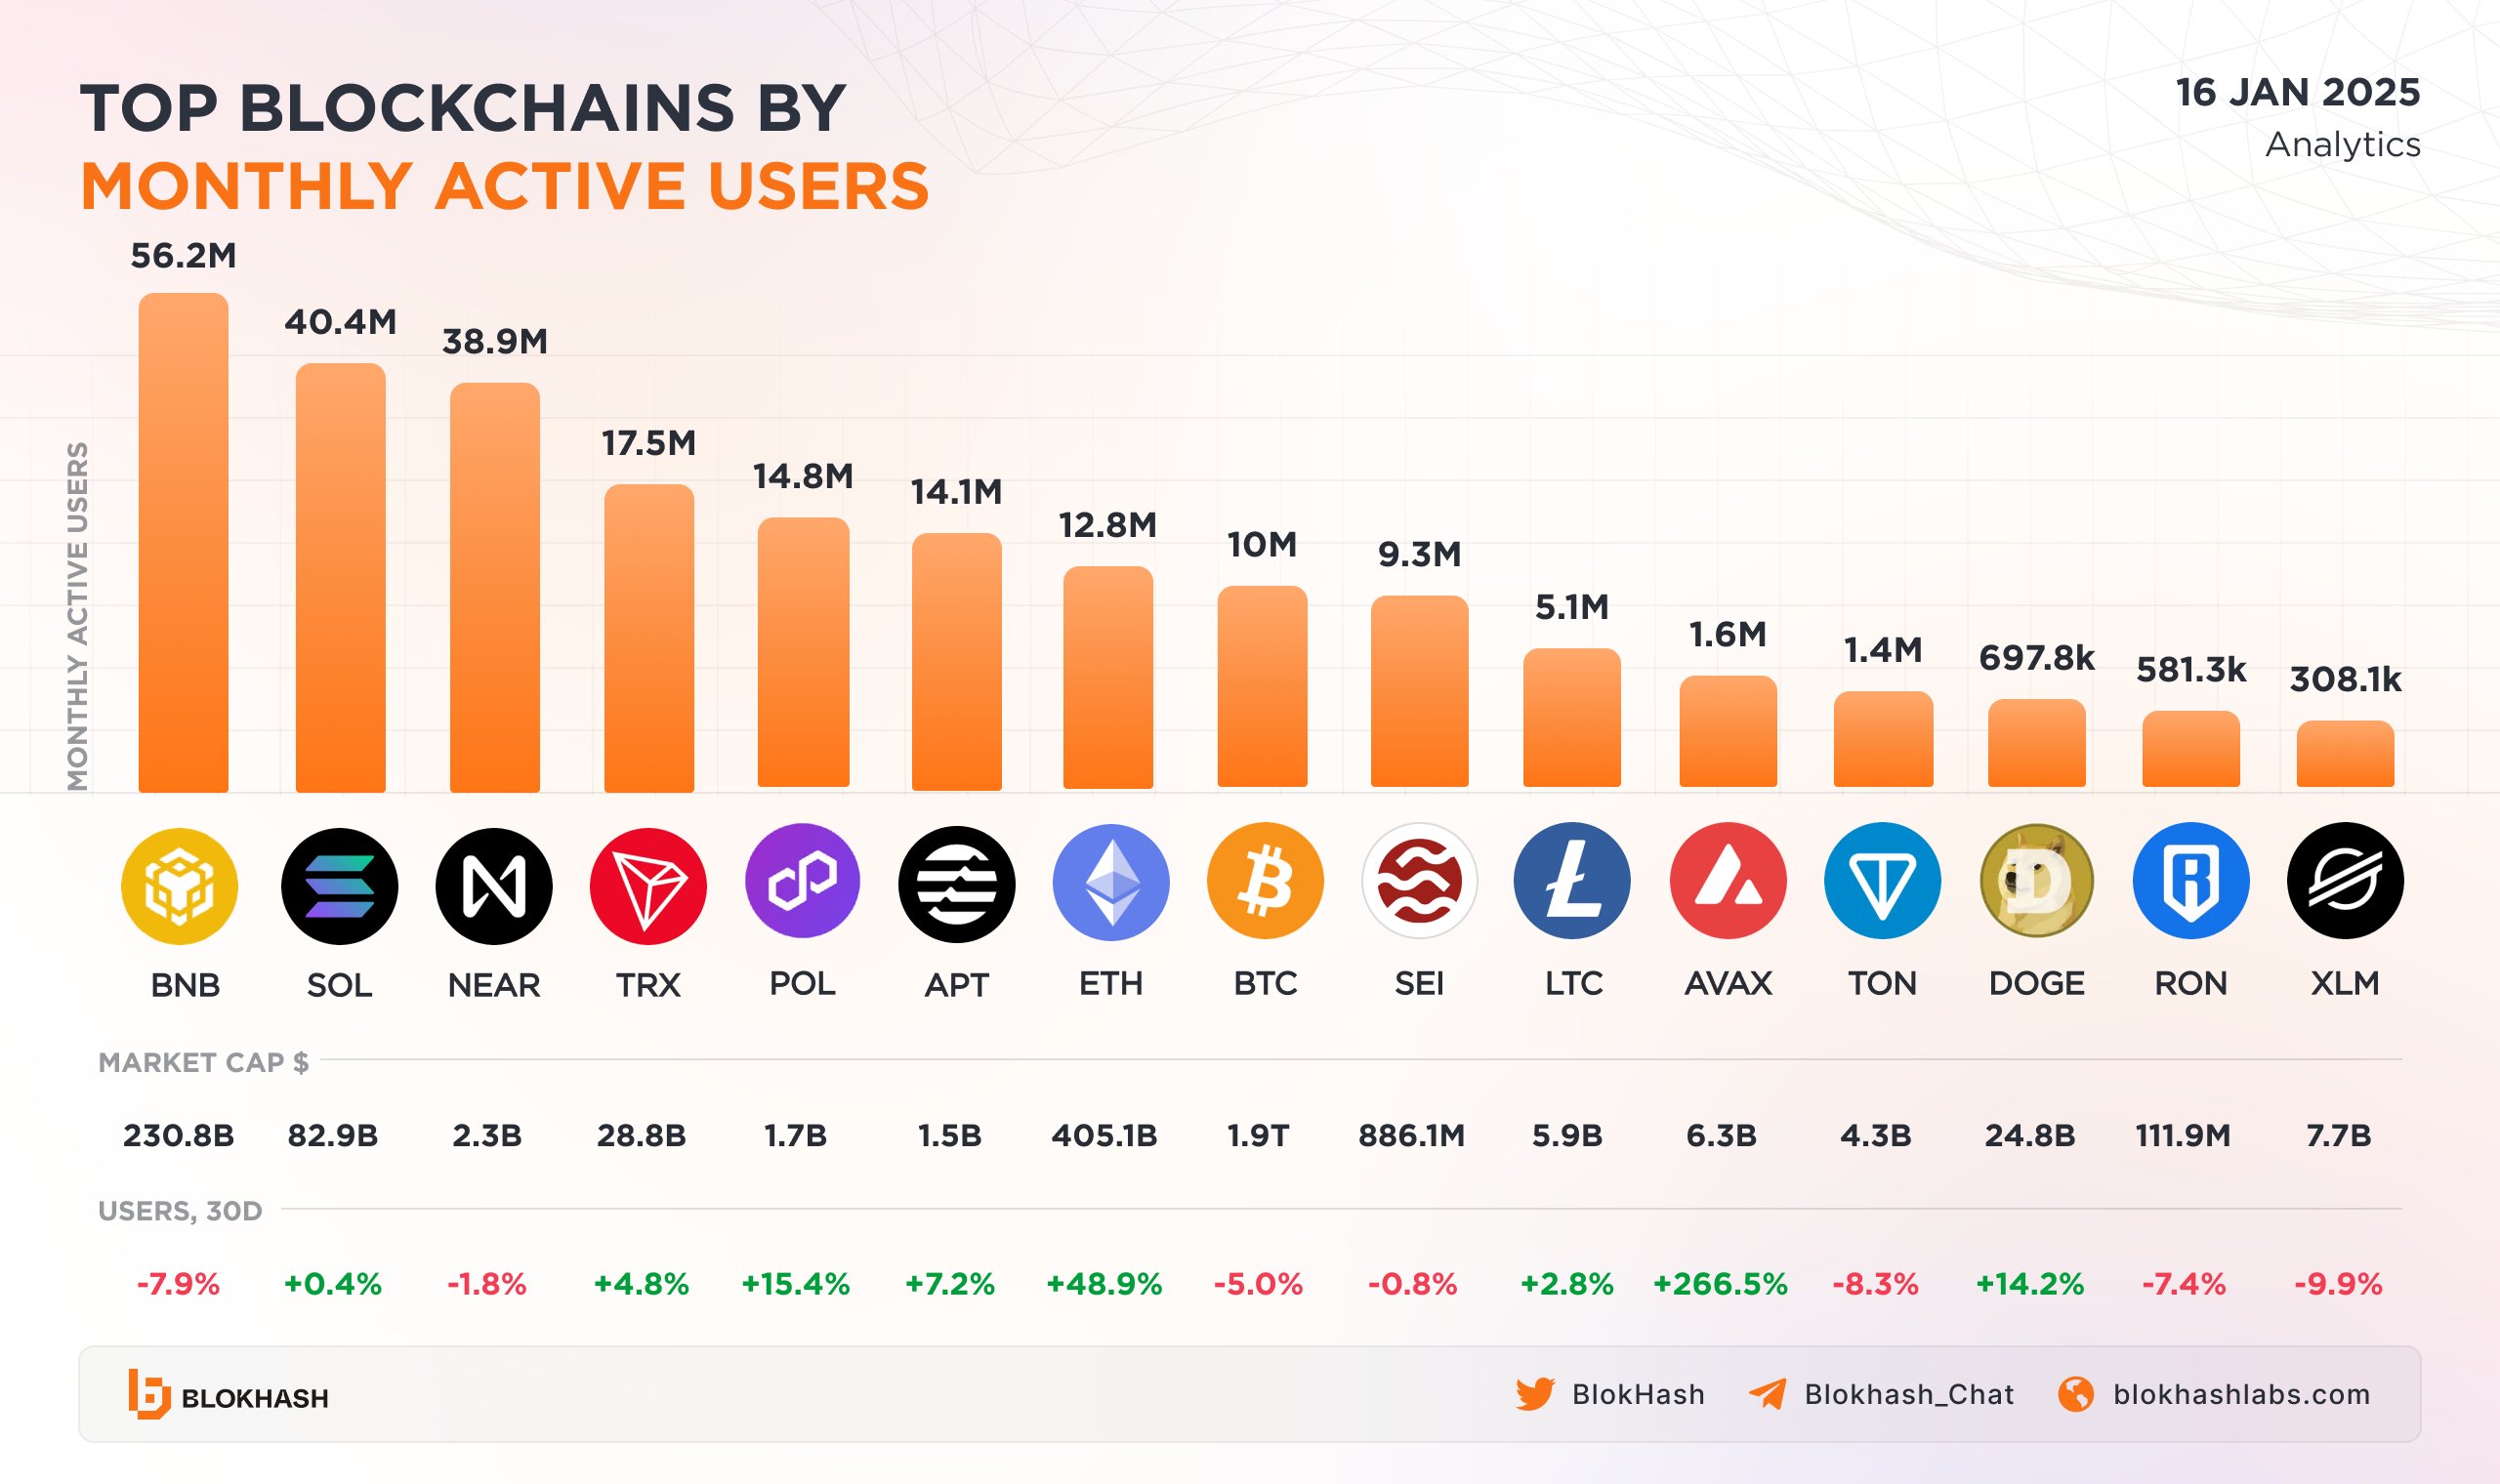
Top 10 Blockchains By Active Users/Source: @BlokHash (X)
More importantly, the daily chart is now revealing a classic bullish reversal structure, suggesting that NEAR could be positioning itself for a meaningful upside continuation.
Inverse Head and Shoulders Pattern Takes Shape
On the daily timeframe, NEAR has formed a well-defined inverse head and shoulders pattern, a setup widely regarded as one of the most reliable bullish reversal formations in technical analysis.
-
The left shoulder developed in early December near the $1.65 region, where selling pressure temporarily paused.
-
This was followed by a deeper decline toward the $1.45 area, forming the head, as broader market weakness weighed on price.
-
The right shoulder then emerged as NEAR once again found support near $1.65, signaling that sellers were losing control.
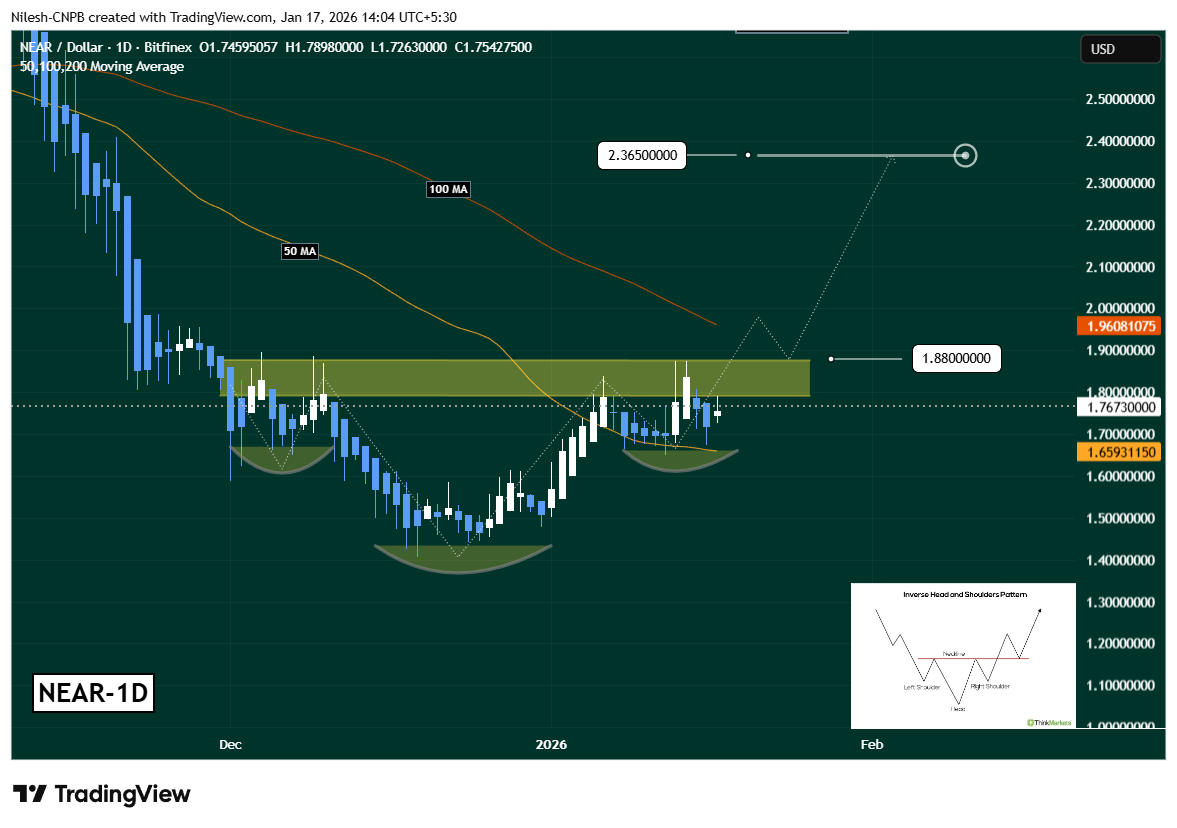
Near Protocol (NEAR) Daily Chart/Coinsprobe (Source: Tradingview)
Since completing this structure, NEAR has rebounded steadily and successfully reclaimed the 50-day moving average, which is now acting as dynamic support. At present, price is consolidating just below a key neckline resistance zone between $1.79 and $1.88, clearly highlighted on the chart.
This compression near resistance often precedes a volatility expansion, suggesting that a decisive move could be approaching.
What’s Next for NEAR?
For bullish momentum to gain confirmation, NEAR needs a strong daily close above the $1.79–$1.88 neckline, ideally followed by a successful retest of this zone as support. Such a move would validate the inverse head and shoulders breakout and confirm a shift in short-term market structure.
Additional strength would come from reclaiming the 100-day moving average near $1.96, which has capped price during the recent downtrend. A break above this level could accelerate upside momentum as sidelined buyers step back in.
If these conditions are met, the measured move projection from the inverse head and shoulders pattern points toward the $2.36 region, representing a potential upside of roughly 26% from the breakout area.
On the downside, failure to clear the neckline could lead to further consolidation. In that scenario, holding above the 50-day moving average and the $1.65 support zone will be crucial to keep the bullish structure intact. A loss of these levels would delay the breakout thesis and shift focus back to range-bound price action.
Bottom Line
NEAR Protocol appears to be coiling beneath resistance, supported by a textbook bullish reversal pattern and improving broader sentiment. While confirmation is still needed, the technical structure suggests accumulation rather than distribution, with buyers gradually gaining control.
Disclaimer: The views and analysis presented in this article are for informational purposes only and reflect the author’s perspective, not financial advice. Technical patterns and indicators discussed are subject to market volatility and may or may not yield the anticipated results. Investors are advised to exercise caution, conduct independent research, and make decisions aligned with their individual risk tolerance.
About Author: Nilesh Hembade is the Founder and Lead Author of Coinsprobe, with over 5 years of experience in the cryptocurrency and blockchain industry. Since launching Coinsprobe in 2023, he has been providing daily, research-driven insights through in-depth market analysis, on-chain data, and technical research.
Disclaimer: The information on this page may come from third parties and does not represent the views or opinions of Gate. The content displayed on this page is for reference only and does not constitute any financial, investment, or legal advice. Gate does not guarantee the accuracy or completeness of the information and shall not be liable for any losses arising from the use of this information. Virtual asset investments carry high risks and are subject to significant price volatility. You may lose all of your invested principal. Please fully understand the relevant risks and make prudent decisions based on your own financial situation and risk tolerance. For details, please refer to
Disclaimer.
Related Articles
PENGU Falls 4.8% as Pudgy Penguins Push New Growth Strategy
PENGU drops 4.8% despite strong Pudgy Penguins ecosystem expansion.
New products aim to drive real-world crypto adoption and engagement.
Token performance lags behind brand growth and investor expectations.
Pudgy Penguins — PENGU, has dropped 4.8%, yet the Pudgy Penguins brand keeps expa
CryptoNewsLand24m ago
Bitcoin meltdown to $10,000 remains likely unless prices reclaim $75,000, analyst says
A familiar voice is back with a familiar, and controversial, call on bitcoin BTC$66,860.50.
Mike McGlone, senior commodity strategist for Bloomberg Intelligence, is reiterating that bitcoin could crash to $10,000.
But this time, he's framed it with a very clear line in the sand: $75,000.
If bitco
CoinDesk1h ago
Arthur Hayes: Bitcoin’s long-term target price is $250k to $750k, and in the short term it could fall below $60k
Arthur Hayes said on a podcast that, because the Federal Reserve has not expanded liquidity, he will not put more money into Bitcoin. He expects his medium- to long-term target price to be between $250,000 and $750,000. He warned that if the Iran–U.S. conflict continues, Bitcoin could fall below $60,000 in the short term. Meanwhile, Charles Schwab will launch spot trading for Bitcoin and Ethereum. Research shows that after major shocks, Bitcoin has performed better than gold and the S&P 500, and its current price has rebounded to $67,300.
GateNews5h ago
The Crypto Fear and Greed Index rises to 13 today, and the market is still in an extreme fear state
Gate News message, April 6, according to Alternative.me data, today the Crypto Fear & Greed Index rose to 13, up 1 point from yesterday’s 12. Despite the index recovering, market sentiment is still in an “extreme fear” state.
GateNews5h ago
Michael Saylor dismisses Schiff's warning that 'MSTR will collapse,' citing 36% annual profits from Bitcoin
Michael Saylor, CEO of MicroStrategy, defends the company's Bitcoin strategy against investor Peter Schiff's warning about MSTR stock. Despite losses, Saylor emphasizes Bitcoin's superior performance compared to gold and the S&P 500 since 2020.
TapChiBitcoin5h ago
BTC 15-minute rise of 0.79%: Institutional pullback and structural fund outflows driving market fluctuations
2026-04-05 22:30 to 2026-04-05 22:45(UTC), the BTC price fluctuated in the range of 67416.0 to 67986.7 USDT. Within 15 minutes, the return reached +0.79%, and the amplitude was 0.85%. The rapid change on the market quickly drew attention, with volatility increasing, but overall trading volume did not show extreme amplification, and sentiment was mainly cautious and volatile.
The main drivers behind this move are the continued withdrawal of institutional funds and large capital net outflows to outside trading platforms. On-chain data shows that in the past 24 hours, the whole-network BTC net outflow was -2,1
GateNews7h ago
