
FET has quietly drifted into a part of its chart that long-term traders tend to care about a lot more than whatever happens on a 5-minute candle.
After taking a brutal hit from its cycle highs, the FET price is now sitting in an area that often separates projects that disappear from those that quietly reset and come back stronger.
So the real question isn’t whether FET is volatile. That’s a given. The question is whether this level marks the start of a real accumulation phase or just another pause before things get worse.
- Zooming Out on the Bigger FET Picture
- Why This Zone Is So Important for FET
- Where the Upside Could Begin to Unfold
Zooming Out on the Bigger FET Picture
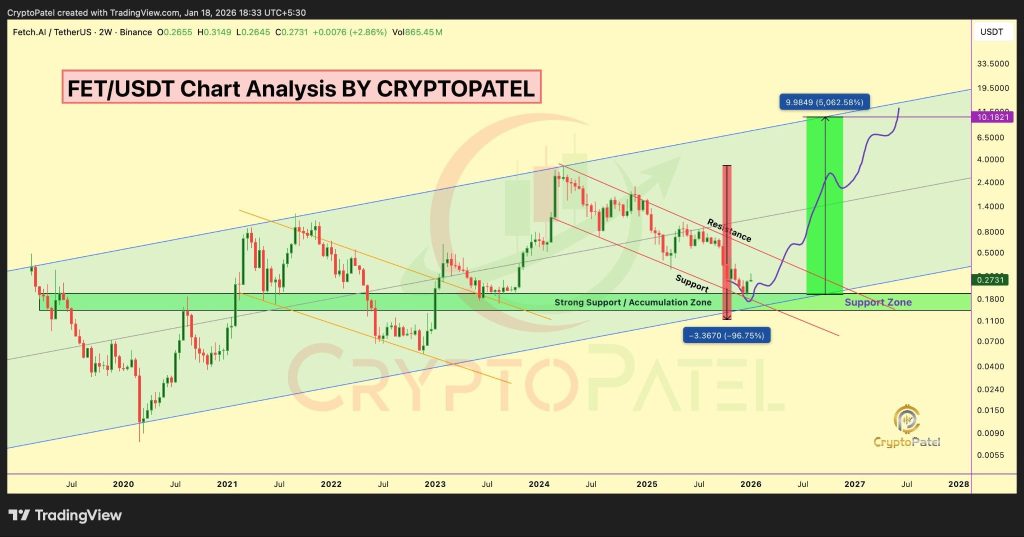
When you look at the higher time frame chart shared by Patel, FET has been moving inside a broad ascending channel that’s been respected all the way since 2020. That alone already says a lot.
Even after dropping almost 97% from its all-time high, the FET price didn’t completely fall apart. Instead, it made its way back to the bottom of that long-term channel and found buyers waiting there.
Source: X/@CryptoPatel
That kind of behavior usually points to a reset rather than a breakdown. When a price retraces that deeply but still holds its macro structure, it often means long-term players are stepping back in instead of walking away.
What makes this even more interesting is the demand zone around $0.19 to $0.20. That area has acted like a real floor, where price started to stabilize instead of free-falling. As long as the FET price stays above this range, the bigger bullish idea remains technically intact.
Is Crude Oil Price About to Repeat Its Most Explosive Pattern from History?_**
Why This Zone Is So Important for FET
Support zones become truly meaningful when several technical factors line up at the same place, and that’s exactly what’s happening here.
The lower boundary of the long-term channel and that horizontal demand zone are basically overlapping. That kind of confluence is what longer-term traders look for because it defines risk and reward very clearly.
In simple terms, it gives the market a clean line in the sand. A higher time frame close below $0.19 would seriously weaken the setup. But as long as that level holds, the chart continues to lean bullish.
And right now, the price behavior itself is telling a story. The FET price isn’t accelerating lower anymore. It’s compressing and calming down, which is often how accumulation phases start after a major correction.
Where the Upside Could Begin to Unfold
CryptoPatel’s targets of $0.60, $1, $2.80, $5, and even $10 might sound wild at first, but when you place them on the chart, they actually line up with previous value zones and the upper boundary of the long-term channel.
A move toward $0.60 would be the first sign that the trend is shifting rather than just bouncing. From there, reclaiming $1 and the $2.80 region would bring the FET price back into areas that defined earlier cycles.
The higher targets near $5 and $10 only really come into play if the broader AI narrative and overall market conditions support a full macro recovery, not just a short-lived relief rally.
The key is to view these levels as long-term scenarios, not short-term promises. They outline what becomes possible if structure, demand, and market momentum all start working in the same direction.
As long as the FET price stays above that $0.19 macro support, the chart keeps its bullish structure. Whether that eventually turns into a true 5000% move will depend on time, execution, and the broader market cycle, but from a technical point of view, the foundation is clearly there.
Disclaimer: The information on this page may come from third parties and does not represent the views or opinions of Gate. The content displayed on this page is for reference only and does not constitute any financial, investment, or legal advice. Gate does not guarantee the accuracy or completeness of the information and shall not be liable for any losses arising from the use of this information. Virtual asset investments carry high risks and are subject to significant price volatility. You may lose all of your invested principal. Please fully understand the relevant risks and make prudent decisions based on your own financial situation and risk tolerance. For details, please refer to
Disclaimer.
Related Articles
Bitmine promoted to the NYSE Main Board! Tom Lee: U.S. stocks may be at a bottom, and selling pressure on Ether could ease
Bitmine has officially moved from the NYSE American board to the main board in the U.S., marking an important milestone for the company. Despite a sharp drop in its share price, it has still increased its share repurchase program to $4 billion. The company holds a large amount of Ether (ETH), and expects that a rebound in the crypto market will help improve its assets and share price performance.
CryptoCity5m ago
Bitcoin Reclaims $76,000 as US March PPI Misses Forecasts
Bitcoin surged past $76,000 following lower-than-expected US Producer Price Index data for March 2026, which indicated a 4% year-over-year increase. The rise reflects strong market support despite declining leveraged positions.
GateNews2h ago
BTC 15-minute rise of 0.64%: a technical breakout of key resistance combined with weak liquidity amplifies volatility
2026-04-14 15:30 to 15:45 (UTC), BTC saw short-term fluctuations within the 74,795.5 to 75,319.3 USDT range, with a return of +0.64% and a range of 0.70%. During this period, market attention warmed up, volatility intensified, trading volume rose slightly compared with the previous hour, and short-term buy orders pushed the price upward quickly.
The main driver of this unusual move was BTC’s short-term technical breakout above the 74,000 USDT key resistance, which generated a long signal and triggered rapid responses from quantitative and programmatic buy orders. At the same time, because the order book depth has been rising since 2025
GateNews2h ago
ETH rose 1.06% in 15 minutes: global political stimulation and a coordinated boost to risk appetite and on-chain activity together drove the move
From 15:30 to 15:45 (UTC) on 2026-04-14, the ETH price range was 2340.75 to 2367.0 USDT. Within 15 minutes, the return rate reached +1.06%, and the amplitude was 1.12%. Market volatility intensified, and on-chain and social attention rose in tandem. Short-term trading activity increased significantly, and investor sentiment shifted to optimism.
The main driving force behind this market move is the direct impact of an international political event on risk appetite. The United States announced a blockade of the Strait of Hormuz in the Middle East region related to the White House, creating a stark contrast with peace signals reportedly coming from Iran, and it triggered uncertainty and panic sentiment in the market.
GateNews2h ago
Bitmine gets promoted to the NYSE main board! Tom Lee: US stocks may be at a bottom, with selling pressure on Ether easing
Bitmine has officially moved from the NYSE American board to the main board, marking an important milestone for the company. Despite a sharp decline in its stock price, it has still increased the share repurchase plan to $4 billion. The company holds a large amount of Ether, and it expects that a rebound in the crypto market will help enhance its assets and stock price performance.
CryptoCity3h ago
Bitcoin Reclaims $75,000 for Second Time Since US-Iran Conflict, Up 7% in 24 Hours
Bitcoin surged to $75,000 amid rising U.S.-Iran tensions, adding $98 billion to its market cap and causing $500 million in liquidations. Technical analysts suggest that holding support above $67,000 could lead to an increase toward $80,000, despite highlighting $50,000 as a critical level if support fails.
GateNews3h ago
