
Key Takeaways
-
AAVE is trading near $173 after a healthy pullback, while still maintaining a strong weekly uptrend.
-
The 4-hour chart shows a clear ascending channel, signaling sustained bullish structure.
-
The 50-period moving average around $171 is acting as key short-term support.
-
A breakdown below support could lead to a dip toward $166, still within bullish structure.
-
A confirmed breakout above $180–$186 may open the door for a move toward $200+.
As of January 18, 2026, Aave (AAVE) is trading around $173.34, posting a mild 0.97% dip over the last 24 hours. Despite the short-term pullback, the broader picture remains constructive, with AAVE still up 4.22% over the past week. This steady recovery signals renewed buyer interest after a prolonged consolidation phase, keeping Aave firmly in focus among top DeFi tokens.
With a market capitalization near $2.65 billion, Aave continues to stand out as one of the most resilient decentralized lending protocols. More importantly, the chart structure is now hinting that a larger move could be brewing beneath the surface.
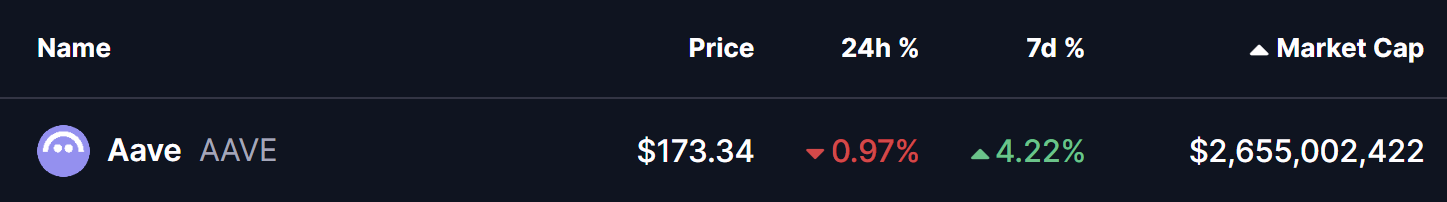
Source: Coinmarketcap
Ascending Channel Structure Emerges
On the 4-hour timeframe, AAVE is respecting a well-defined ascending channel, a bullish pattern characterized by a sequence of higher highs and higher lows. Price action has consistently bounced from the lower boundary of the channel, indicating that buyers are stepping in on dips rather than waiting for deeper pullbacks.
Recently, AAVE faced rejection near the upper boundary around $180.43, triggering a short-term retracement. The pullback, however, has been orderly rather than impulsive, with price now hovering just above the 50-period moving average near $171.09, which is acting as immediate dynamic support.
This behavior suggests healthy consolidation rather than trend exhaustion, keeping the bullish channel structure intact for now.
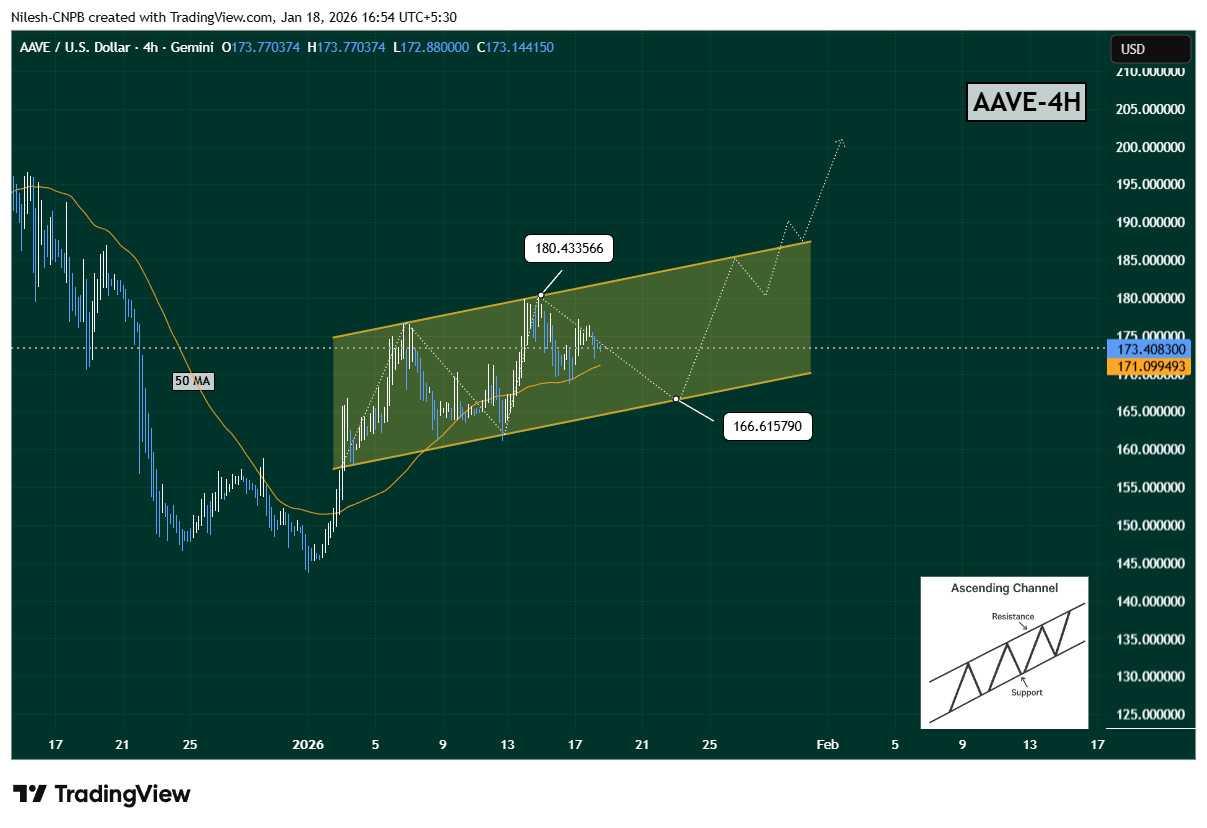
AAVE 4H Chart/Coinsprobe (Source: Tradingview)
What’s Next for AAVE?
If AAVE fails to hold the 50 MA, the next likely downside test sits near the lower boundary of the ascending channel around $166.61, representing a potential 4% downside from current levels. A move into this zone would still be considered a normal corrective pullback within the broader bullish structure.
Then a strong bounce from channel support could send AAVE back toward the upper boundary around $180–$186 resistance zone. A clean breakout above this region would signal strength returning to buyers and could open the door for an accelerated move toward the psychological $200 level and beyond.
That said, patience is key. A confirmed breakout above channel resistance would provide much stronger validation than anticipation alone.
Bottom Line
Aave is quietly building a bullish continuation setup after months of sideways action. The ascending channel on the 4-hour chart highlights steady accumulation, with buyers defending key support levels.
If AAVE rebounds from channel support, a retest of $180–$186 looks likely — and a breakout there could quickly shift momentum toward the $200+ zone. Until then, the current consolidation remains a critical phase that could define AAVE’s next major move.
All eyes are now on how price reacts around support — because the next bounce may determine whether bulls take full control heading into next week.
Disclaimer: The views and analysis presented in this article are for informational purposes only and reflect the author’s perspective, not financial advice. Technical patterns and indicators discussed are subject to market volatility and may or may not yield the anticipated results. Investors are advised to exercise caution, conduct independent research, and make decisions aligned with their individual risk tolerance.
About Author: Nilesh Hembade is the Founder and Lead Author of Coinsprobe, with over 5 years of experience in the cryptocurrency and blockchain industry. Since launching Coinsprobe in 2023, he has been providing daily, research-driven insights through in-depth market analysis, on-chain data, and technical research.
Disclaimer: The information on this page may come from third parties and does not represent the views or opinions of Gate. The content displayed on this page is for reference only and does not constitute any financial, investment, or legal advice. Gate does not guarantee the accuracy or completeness of the information and shall not be liable for any losses arising from the use of this information. Virtual asset investments carry high risks and are subject to significant price volatility. You may lose all of your invested principal. Please fully understand the relevant risks and make prudent decisions based on your own financial situation and risk tolerance. For details, please refer to
Disclaimer.
Related Articles
Bitcoin Rebounds to $74K on U.S.-Iran Framework Deal, But Market Skepticism Remains
Bitcoin's recent rise to mid-$74,000 followed a risk asset rally linked to a U.S.-Iran nuclear framework, but skepticism remains due to flat Treasury yields and unchanged gold prices. The core issue of uranium enrichment persists, and while on-chain data shows BTC's gradual advance, options markets reflect doubts about a sustained breakout. Overall, analysts see the rally as temporary, with macro conditions still tight and potential downside risks.
GateNews2h ago
Cardano Traders Watch $0.243 Support Level as ADA Price Faces Critical Decision
Cardano (ADA) is at a crucial support level of $0.243, with potential gains to $0.30 if it holds. A daily close below this could lead to declines toward $0.10. Currently, trading volume is around $500 million, with ADA notably below its all-time high.
GateNews4h ago
ETH/BTC Price Ratio Rebounds to 0.0313 in Q1 2026 as Ethereum User Base Surges 82%
In Q1 2026, the Ethereum-to-Bitcoin price ratio reached a three-month high at 0.0313. Ethereum added 284,000 users and surpassed $180 billion in stablecoin supply. Bitcoin remained strong above $74,000, driven by significant ETF inflows.
GateNews9h ago
Why is Bitcoin up today? Trump says Iran is seeking a truce, and risk assets move higher across the board
On April 15, Bitcoin rebounded about 6% after Trump said Iran is seeking to reach an agreement, breaking above $75,000. Expectations for the resumption of U.S.-Iran negotiations warmed up, lifting Asian stock markets. Technically, roughly $6 billion worth of short positions were forced to close, accelerating the rebound. Analysts said that if the U.S.-Iran situation continues to ease, Bitcoin could break through $80,000, and they predicted it may reach $150,000 by year-end.
MarketWhisper13h ago
Bitmine is promoted to the NYSE main board! Tom Lee: US stocks may be at a bottom, and selling pressure on Ether could ease
Bitmine officially transferred from the NYSE American market to the main board, marking a significant milestone for the company. Despite a sharp drop in its share price, it still increased the share repurchase program to $4 billion. The company holds a large amount of Ether, and expects that a rebound in the crypto market will help improve its assets and share price performance.
CryptoCity13h ago
ETH 15-minute up 0.66%: On-chain large transfers in sync drove a net inflow of funds, boosting spot buying pressure
2026-04-15 00:00 to 00:15 (UTC), ETH shows a local anomaly. The 15-minute return rate is +0.66%. The trading price range is 2321.93–2343.2 USDT, with a range of 0.92%. During this period, market attention increased, volatility slightly intensified, buy pressure in the order book shifted upward in the short term, and quickly pushed spot prices up into a key resistance area.
The main drivers of this anomaly are large on-chain transfers and inflows of capital in combination. At the beginning of the window, multiple large ETH transfers appeared, including 8,676 ETH and 6,551 ETH, respectively, transferring from a large source to the
GateNews13h ago
