
Key Takeaways
-
Immutable (IMX) is gaining attention as the gaming crypto sector shows renewed strength in both market cap and volume.
-
The weekly chart points to a developing Power of 3 (PO3) structure, often seen near major market bottoms.
-
IMX has completed a long accumulation phase and appears to be stabilizing after a manipulation-driven breakdown.
-
Reclaiming the $0.35 level and the 50-week moving average near $0.53 is crucial to confirm bullish continuation.
-
A breakout above $0.815 could open the door for a larger upside move toward the $1.42 region in the coming months.
In the cryptocurrency market today, gaming tokens are back in the spotlight, with** Immutable (IMX) **drawing increased attention. The overall gaming narrative market cap has climbed by 2.99%, while trading volume has jumped a notable 9.57% over the past 24 hours.
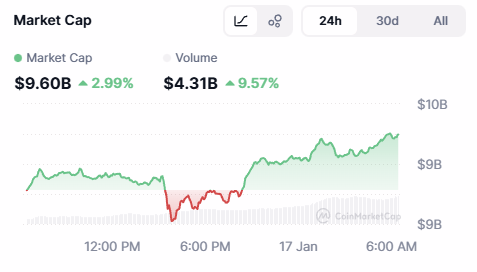
Source: Coinmarketcap
Riding this momentum, IMX is up nearly 7% on the day. More importantly, the higher-timeframe chart is beginning to reveal a larger technical structure that could be setting the stage for a meaningful upside move in the weeks ahead.
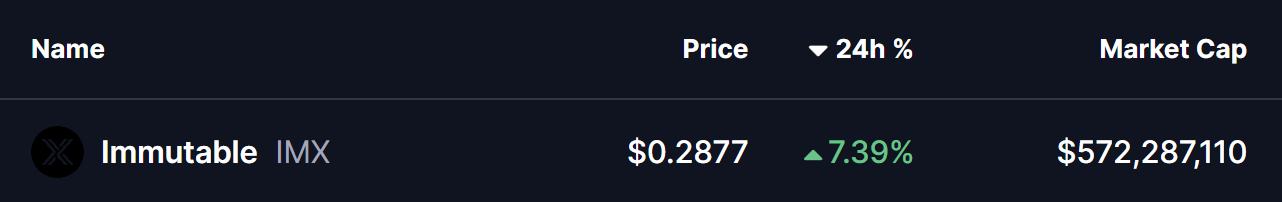
Source: Coinmarketcap
Weekly Chart Signals a Bullish Move
From a technical perspective, the weekly **IMX **chart suggests the formation of a classic Power of 3 (PO3) structure — a pattern often seen near major market bottoms and trend transitions. This setup typically unfolds in three phases: accumulation, manipulation, and expansion, with the strongest price move usually emerging once the expansion phase begins.
Accumulation Phase
Between February and November 2025, IMX spent an extended period consolidating within a clearly defined range. Price action remained capped near the $0.815 resistance zone, while buyers consistently defended the $0.35 support area. This prolonged sideways movement reflects steady accumulation, where long-term participants quietly build positions while volatility remains compressed.
Manipulation Phase
During the broader market downturn in November 2025, IMX broke decisively below the $0.35 accumulation support, sliding toward a local low around $0.2031. This sharp breakdown, highlighted on the chart by the lower shaded zone, aligns well with the manipulation phase of the Power of 3 pattern.
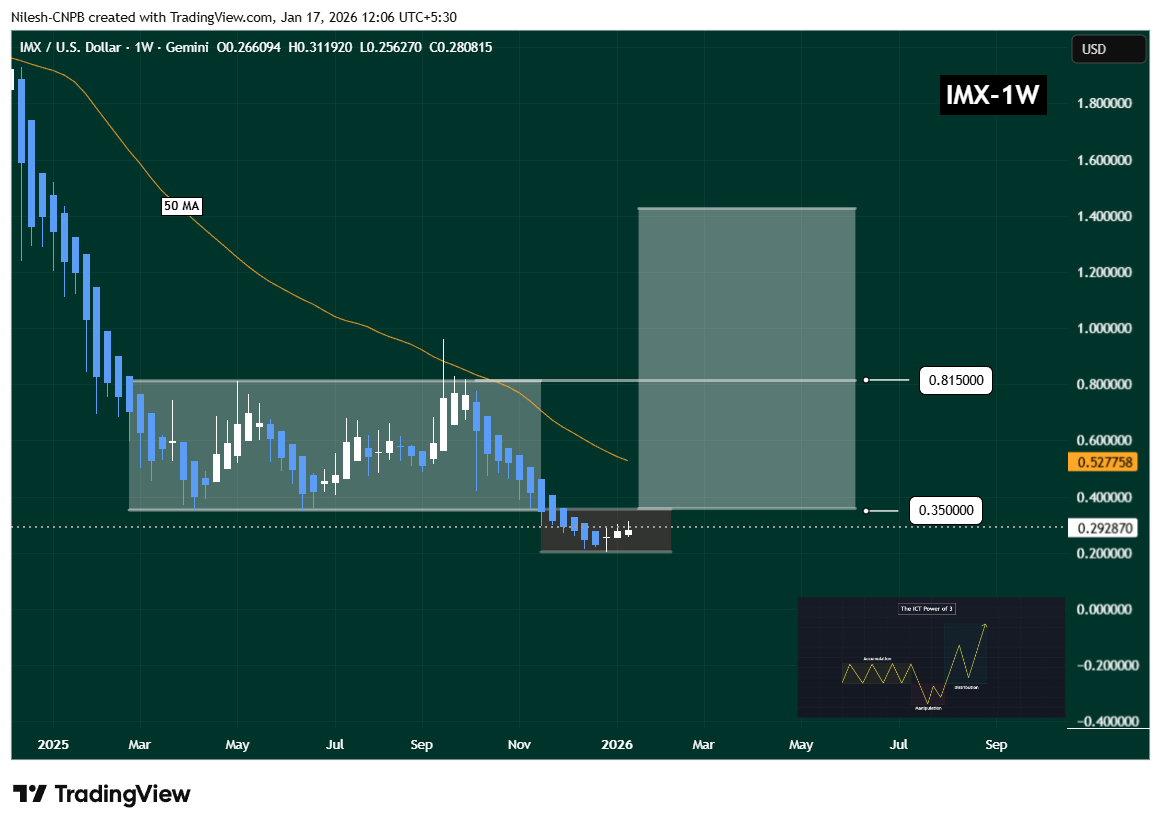
Immutable (IMX) Weekly Chart/Coinsprobe (Source: Tradingview)
At this stage, stop losses are triggered, sentiment turns bearish, and weaker hands are forced out of the market. Notably, selling pressure has started to fade near this region, with IMX now trading around $0.2928 — an early sign that downside momentum may be losing steam.
What Comes Next for IMX?
Currently, IMX remains in the lower portion of the manipulation phase, trading just below the crucial $0.35 level. This zone is particularly important, as it previously acted as strong accumulation support and now serves as a key decision area.
For bullish momentum to gain credibility, IMX must first reclaim $0.35 and then push above the 50-week moving average, which sits near $0.5277. A sustained move above these levels would strongly suggest a transition into the expansion phase of the Power of 3 structure, where upside momentum typically accelerates.
If price manages to break and hold above the $0.815 resistance, the longer-term chart projection opens the door toward the $1.42 region in the coming months — a level that aligns with prior structural targets on the weekly timeframe.
That said, the setup remains conditional. As long as IMX trades below $0.35, downside risks cannot be completely ruled out, and price may continue to experience volatility. Holding current lows and reclaiming key resistance zones will be critical for bulls to confirm a broader trend reversal.
Bottom Line
While Immutable (IMX) has already posted a strong short-term bounce, the bigger story lies in its higher-timeframe structure. The ongoing stabilization near cycle lows, combined with a developing Power of 3 pattern, suggests that IMX could be preparing for a larger move — provided key levels are reclaimed. For now, patience is warranted, but the chart hints that the worst of the downside may already be behind.
Frequently Asked Questions (FAQ)
Is Immutable (IMX) bullish right now?
IMX is showing early signs of stabilization after a deep correction. While it is not fully bullish yet, reclaiming $0.35 and the 50-week moving average would significantly strengthen the bullish case.
What is the Power of 3 pattern in crypto trading?
The Power of 3 (PO3) is a market structure consisting of accumulation, manipulation, and expansion phases. It is often seen near major bottoms before strong trend reversals.
Disclaimer: The views and analysis presented in this article are for informational purposes only and reflect the author’s perspective, not financial advice. Technical patterns and indicators discussed are subject to market volatility and may or may not yield the anticipated results. Investors are advised to exercise caution, conduct independent research, and make decisions aligned with their individual risk tolerance.
About Author: Nilesh Hembade is the Founder and Lead Author of Coinsprobe, with over 5 years of experience in the cryptocurrency and blockchain industry. Since launching Coinsprobe in 2023, he has been providing daily, research-driven insights through in-depth market analysis, on-chain data, and technical research.
Disclaimer: The information on this page may come from third parties and does not represent the views or opinions of Gate. The content displayed on this page is for reference only and does not constitute any financial, investment, or legal advice. Gate does not guarantee the accuracy or completeness of the information and shall not be liable for any losses arising from the use of this information. Virtual asset investments carry high risks and are subject to significant price volatility. You may lose all of your invested principal. Please fully understand the relevant risks and make prudent decisions based on your own financial situation and risk tolerance. For details, please refer to
Disclaimer.
Related Articles
ETH/BTC Price Ratio Rebounds to 0.0313 in Q1 2026 as Ethereum User Base Surges 82%
In Q1 2026, the Ethereum-to-Bitcoin price ratio reached a three-month high at 0.0313. Ethereum added 284,000 users and surpassed $180 billion in stablecoin supply. Bitcoin remained strong above $74,000, driven by significant ETF inflows.
GateNews2h ago
Why is Bitcoin up today? Trump says Iran is seeking a truce, and risk assets move higher across the board
On April 15, Bitcoin rebounded about 6% after Trump said Iran is seeking to reach an agreement, breaking above $75,000. Expectations for the resumption of U.S.-Iran negotiations warmed up, lifting Asian stock markets. Technically, roughly $6 billion worth of short positions were forced to close, accelerating the rebound. Analysts said that if the U.S.-Iran situation continues to ease, Bitcoin could break through $80,000, and they predicted it may reach $150,000 by year-end.
MarketWhisper6h ago
Bitmine is promoted to the NYSE main board! Tom Lee: US stocks may be at a bottom, and selling pressure on Ether could ease
Bitmine officially transferred from the NYSE American market to the main board, marking a significant milestone for the company. Despite a sharp drop in its share price, it still increased the share repurchase program to $4 billion. The company holds a large amount of Ether, and expects that a rebound in the crypto market will help improve its assets and share price performance.
CryptoCity6h ago
ETH 15-minute up 0.66%: On-chain large transfers in sync drove a net inflow of funds, boosting spot buying pressure
2026-04-15 00:00 to 00:15 (UTC), ETH shows a local anomaly. The 15-minute return rate is +0.66%. The trading price range is 2321.93–2343.2 USDT, with a range of 0.92%. During this period, market attention increased, volatility slightly intensified, buy pressure in the order book shifted upward in the short term, and quickly pushed spot prices up into a key resistance area.
The main drivers of this anomaly are large on-chain transfers and inflows of capital in combination. At the beginning of the window, multiple large ETH transfers appeared, including 8,676 ETH and 6,551 ETH, respectively, transferring from a large source to the
GateNews7h ago
BTC 15-minute drop of 0.54%: Liquidity worsens and whales actively reduce positions, putting short-term pressure on the market
From 22:15 to 22:30 (UTC) on 2026-04-14, BTC saw a short-term pullback of 0.54% within the high-range band of 73911.6 - 74314.4 USDT, with a return of -0.54%. During this period, market swings were evident, volatility intensified, attention from the market quickly increased, and downward pressure on the order book was prominent.
The main drivers behind this unusual move were the continued deterioration of market liquidity and a clear lack of order book depth, which made the BTC price extremely sensitive to large sell orders. At the same time, during the key time window, whale wallets carried out large transfers and also engaged in active de-risking,
GateNews8h ago
ETH 15-minute drop of 0.61%: Sell orders concentrate and release while bearish sentiment intensifies, increasing downward pressure
2026-04-14 22:15 to 2026-04-14 22:30 (UTC) during this period, on the 15-minute K-line, ETH recorded a -0.61% return, with a price range of 2313.68 to 2328.54 USDT and a fluctuation of 0.64%. During this period, market attention increased, trading volume expanded noticeably, and heightened short-term volatility sparked strong interest in the subsequent trend.
The main drivers behind this unusual move are the concentrated release of sell orders and continued net outflows of on-chain funds. Specifically, the sell volume share rose to 52%, higher than the buy side at 48%, indicating heavy selling pressure
GateNews8h ago
